On October 18th 2012, the New England Journal of Medicine published a paper linking chocolate consumption and Nobel prizes by country. I’m sure you’ve heard about the study, it went pretty much viral after that, people found it cool to post and re-post on Facebook, Twitter…
There have also be countless articles on the topic, and while the methodology and approach of the original paper are highly debatable (and actually there is quite some talk about the paper being a joke from the New England Journal of Medicine), I still found something very troubling in how the results of the paper were paraphrased amongst journalists and friends.
To recall the setup, Franz Messerli (happens to be Swiss), looked at chocolate consumption per capita and number of Nobel Laureates per 10 million people across 23 countries, and found the following results:
All 23 data points, with the slight exception perhaps of Sweden and Germany, seem to fall on a straight line! And Pearson’s correlation coefficient of 0.791 is statistically significant!
I haven’t read the paper myself but the last part seems to attempt to explain the phenomenon, namely by the increased cognitive abilities derived from higher chocolate intake.
But as I mentioned, the headlines of articles reporting the findings hurt me the most, ranging from the conservative interpretation (Does chocolate make you clever?, and Eating chocolate may help you win Nobel Prize) to the absurd leapfrog conclusions (Why Do the Swiss Eat So Much Chocolate?, Secret to Winning a Nobel Prize? Eat More Chocolate).
Of course, journalists need to shoot for the sensational, but the misunderstanding between correlation and causation is a very real and widespread one, and so I thought I would use the Chocolate / Nobel Prize example to illustrate how the two concepts differ.
- The first hypothesis could be that this was just a random coincidence and that countries not satisfying the “model” were dropped out (think of all the top IQ countries).
- An alternative (third variable) could be that countries in northern Europe tend to eat more chocolate and tend to have more laureates per capita. Do they have longer and colder winters? Because of the long winters you tend to eat more chocolate to improve morale? Because of the long winters you tend to eat spend more time studying than if you had a warm sunny beach outside? And haven’t sociologists linked long cold winters to increased suicide rates and crimes? (this is what led me to take a closer look at crime-related variables)
To do so, I will first replicate the original analysis as closely as possible, but also look at some additional metrics.
I was not able to pull the original dataset, so searched the web as best as I could to find chocolate consumption numbers and Nobel prizes per capita.
As boasted in the paper, I also got a great correlation, albeit not as significant (0.658 instead of 0.791). First little red flag, it appears that the number is quite volatile and rather data-sensitive. While it is hard to lie about Nobel Prize laureates, one might wonder if there even is anything such as an official chocolate consumption database?
Step 2 consisted in looking at another metric which is theoretically tied to Nobel Prize winning according to the paper: cognitive ability. Of course the first proxy that comes to mind for this metric is IQ. I therefore replicated the analysis looking at correlation between chocolate consumption and IQ.
Wow, the value dropped to 0.279! Even more troubling: only one of the top top IQ countries (Japan) was from the original analysis as there was no chocolate consumption data for them. Second red flag: why were only 23 countries included in the original paper?
So chocolate makes you smart enough to win a Nobel, but not enough to increase IQ?
But why settle on Nobel prize laureates and IQ, why not look at a whole set of metrics and test their correlations with chocolate consumption? With feminine intuition from my wife, I started focusing on crime-related metrics, and here are the results:
Kidnappings, correlation = 0.11
Drug offenses, correlation = 0.42
Rape victims, correlation = 0.45
What about total crimes per capita?
Correlation of… 0.72 !!! Even higher than for Nobel Prize! Stop eating that chocolate right now, or you will end up in jail before you know it!
So taking a step back, what have we shown? Well the first point is that if you compare enough metrics to each other, you are bound, just out of pure chance to come up with high correlation that does not mean anything. Just like if you flip a coin enough time (in the sense of quit your job right now) you are bound to get 20, 30 even 100 consecutive heads. Does it mean anything? No, you just lost your whole life for nothing.
The second important point is that there could be some link between the two metrics in question. But it does not mean that metric 1 impacts impact 2! Nor does it mean than metric 2 impacts metric 1! (the article never wonders whether Nobel prize laureates could have enough appetite for chocolate to lower their countries average consumption value). It could very well be that there is a third metric impacting both metric 1 and metric 2. The example I like best from my stats class is: does carrying a lighter increase your risk of getting lung cancer? Of course not why would it? Even if I told you there was a strong correlation between the two? Hmmmm. But here’s the thing, you are actually without knowing it comparing smokers to non-smokers. Smokers tend to have a greater probability of carrying lighters around, and of having greater risk for lung cancer. But carrying a lighter does cause lung cancer, and having lung cancer certainly doesn’t make you more prone to carrying a lighter!
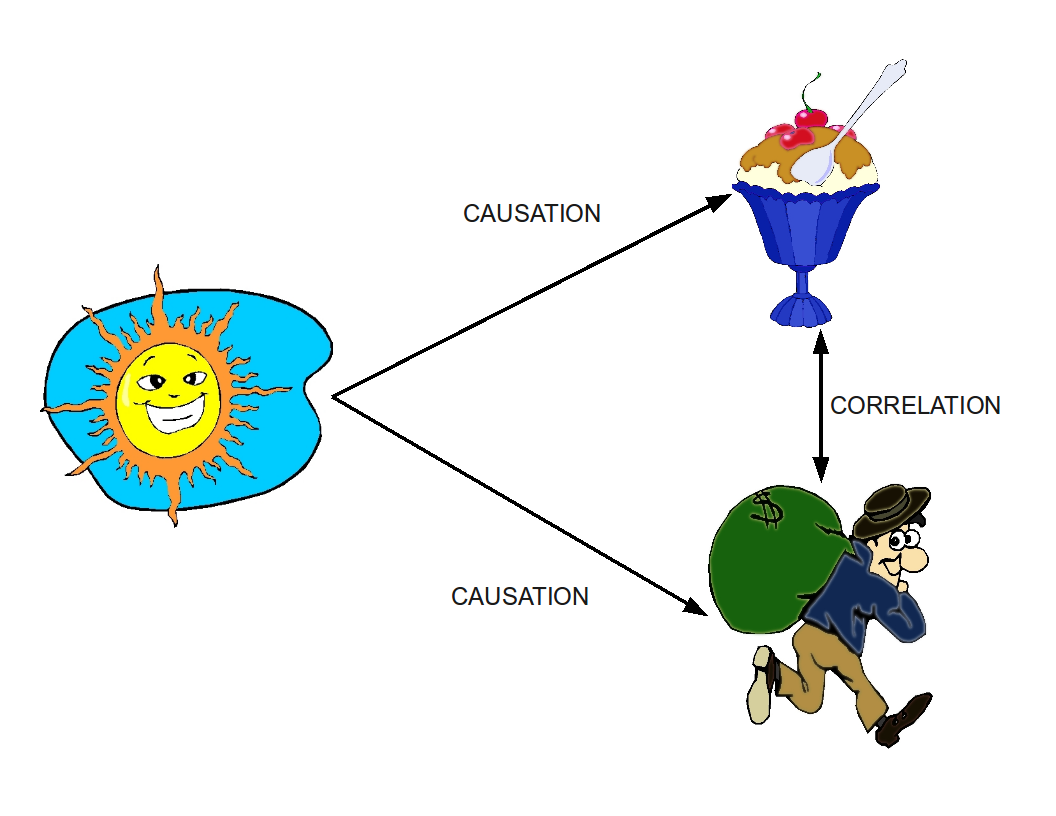
OK, back to chocolate. What’s going on behind the scenes and behind the nice straight line? As discussed previously, there could be one of two phenomena going on:
Go ahead and eat all the chocolate you want, but hold off on booking that flight to Oslo…
I would also like to point out this article by James Winters and Sean Roberts which features a surprisingly similar analysis to mine (looking at IQ then at serial killers). Nobody copied anybody, I was just relieved to see I wasn’t the only one finding for correlation VS causation!