Monday, December 15, 2014

Clutch or not clutch, that is the stat question


There has always been debate on what clutch is, how it is measured, who performs best in these moments, the list goes on...
I'm definitely not going to settle the debate once and for all in one blog post, but wanted to share a few thoughts and ideas instead.

When we talk about clutch in the NBA, a few names immediately come to mind, Jordan, Bryant, Bird, Miller and Horry. Countless lists can be found with the simplest search, all as subjective as the next ("that was an incredible play in that game!").

But can we actually measure it, and rank players by it?

nba.com has a whole section dedicated to clutch stats on its website. A great first step but amidst all the numbers it's hard to compare players.

SBNation also tackled the issue, clustering players into recipients, creators and scorers (not mutually exclusive) during clutch time (Is Kobe Bryant Actually Clutch? Looking At The NBA's Best Performers In Crunch Time). The article stresses the importance of efficiency by placing all performances in perspective using possessions per 48 minutes on the x-axis. Here are the results for the 2010-2011 season:


Efficiency is a trademark at SB Nation, and Kobe is their primary scapegoat given this viewpoint:


SBNation's perspective is interesting and allows swift comparisons across players, but I feel that it lacks some rigor and robustness around these numbers. How large are the sample sizes? Are the effects significant? Which players are shouldering the most pressure and confronting it head-on? The author underlines these issues himself:

But all of that said ... how reliable are these numbers? There's a school of thought that firmly believes that "clutch" is in the eye of the beholder. They contend that as fans, we see things that may not actually be there. We see Kobe hit a step-back 20-footer and credit his clutch ability, when perhaps we simply should have attributed it to the fact that he's amazing at basketball (in the 1st or 4th quarter).
There are rigorous methods of testing for statistical significance. Rather than dive into those, however, a glance at some yearly efficiency trends can be just as telling.


I also came across this very nice post, Measuring Clutch Play in the NBA, on the Inpredictable blog which offers an interesting and elegant alternative. In a nutshell, the idea is to look at how each player's actions impacted his team's probability of winning the game, referred to as Win Probability Added WPA. Made shots, rebounds, steals increase your team's probability, while missed shots and turnovers hurt it. Some adjustments are required to clean up the cumulative WPA for each player (essentially comparing the impact of the same play under normal circumstances), but it does at the end provide an intuitive metric that makes sense and allows quick comparisons.

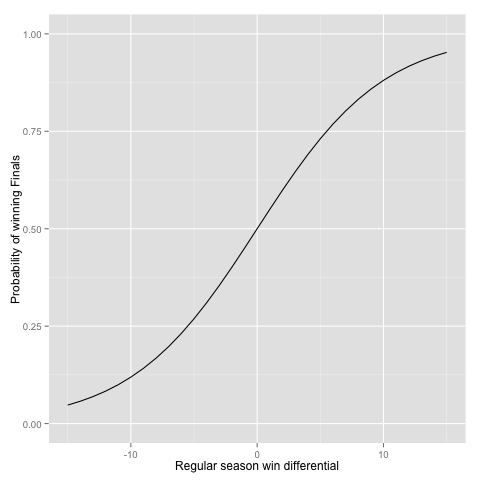
I do however have some slight concerns with this metric. The first is that, unless I misread, the metric is cumulative, so that players with more minutes in the clutch have more opportunities to modify their team's WPA. The second is best illustrated with a small example: with a few seconds remaining, if a player makes a two-point shot with his team down by 2 or down by 1, it will make a huge impact on the WPA: in the first case they're tied, likely to go to overtime with 50/50% for each team to win the game, in the other case his team leads by 1 and have a good chance of winning the game. But is it fair to credit the player with very different WPA in both cases? What really matters is that, under tremendous pressure, the player made the shot.


This in turn leads to another question: what was the likelihood of that shot going in in the first place? How frequently does that player make that shot under normal circumstances without the game on the line? How frequently do other players make the shot? How much does clutch pressure reduce the average player's chance of making the shot, and was the player able to rise to the occasion and overcome the pressure?

According to Stephen Shea in his book Basketball Analytics, "90% of teams performed worse (in terms of shooting percentages) in the clutch than in non-clutch situations." Can this me modeled? How significant is the effect?

I will try to explore this path further, looking into statistical models that would offer some elements of response to these questions.

But looking at all hat has been said it seems the debate originates from the fact that "being clutch" is never well-defined. Suppose we could at any point during a game give a score from 0 to 100 as to how good a player is. Suppose player A is at 90 throughout non-clutch times, but drops to 80 in clutch situations. Whereas player B is at 60 in non-cutch situations, but steps his game up to 70 when the game is on the line. Which is clutchier? The one with highest absolute value, or the one stepping up his game and taking the pressure head-on. Answering this would already be a giant step in the right direction.

In the meantime, please enjoy this youtube compilation of clutch shots:

Tuesday, October 7, 2014

Are remakes in the producers' interests?

Two-bullet summary:

  • Similarly to sequels, remakes perform significantly worse than originals from a rating perspective
  • If you want to predict a remake's IMDB rating, a quick method is to multiply the original movie's rating by 0.84


In three previous posts (first, second, third) I looked at Hollywood's lack of creation and general risk-aversion by taking a closer look at the increasing number of sequels being produced despite the fact that their IMDB rating is significantly worse than the original installment.

We were able to confirm the expected result that sequels typically have worse ratings than the original (only 20% have a better rating), and the average rating drop is 0.9.


Those posts would not have been complete without looking at another obvious manifestation of limited creativity: remakes!

Before plunging into the data, a few comments:

  • finding the right data was instrumental. Because remakes don't necessarily have the same title or because movies may have the same title without being remakes, the data needed to be carefully selected. I finally settled for Wikipedia's mapping Wikipedia. I did however find some errors along the way so bear in mind that the data is not 100% accurate nor exhaustive;
  • one of the greatest drops in ratings was for Hitchcock's classic Psycho (there should be a law against attempting remakes of such classics!), with Gus Van Sant's version getting a 4.6, compared to Hitchcock's 8.6;
  • adapting Night of the Living Dead to 3D saw a drop from 8.0 to 3.1;
  • the best improvement for remake rating was for Reefer Madness, originally a 1936 propaganda on the dangers of Marijuana (3.6), but the tongue-in-cheek 2005 musical remake with Kristin Bell got a 6.7;
  • Ocean's Eleven was originally a 1960 movie with Frank Sinatra, but the exceptional casting for the version we all know with Damon, Clooney and Pitt led to a nice rating improvement (from 6.6 to 7.7)

Let's take a quick look at the data, comparing original rating to remake rating, the red line corresponds to y = x, meaning that any dot above the line corresponds to a remake that did better than the original, whereas anything under is when the original did better:


The distribution of the difference between remake and original is also quite telling:


The first obvious observation is that, as expected, remakes tend to do worse than the original movie. Only 14% do better (compared to 20% for sequels) and the average rating difference is -1.1 (compared to -0.9 for sequels).

The other observation is that the correlation is not as good as we had seen for sequels. This could make sense as in sequels many parameters are the same as for the original movie (actors, directors, writers). One reason parameters are much more similar for sequels than remakes is the timing between original and remake/sequel: 77% of sequels come less than 5 years after the original installment, whereas 50% of remakes come within 25 years! Parameters are more similar and your fan base has remained mostly intact.

From a more statistical point a view, a paired t-test allowed us to determine that the rating decrease of -1.1 was statistically significant at the 95% level (+/- 0.1).

In terms of modeling, a simple linear model gave us some insight for prediction purposes. In case you want to make some predictions to impress your friends, your best guess to estimate a remake's rating is to multiply the original movie's rating by 0.84.

The original Carrie movie from 1974 had a rating of 7.4, whereas the remake that just came out has a current rating of 6.5 (forecast would be 0.84 * 7.4 = 6.2). Given that movie ratings tend to drop a little after first few weeks of release, that's a pretty good forecast we had there! The stat purists will argue that this results is somewhat biased as Carrie was included in the original dataset...


Taking a step back, why does Hollywood continue making these movies despite anticipating a lower quality movie?

The answer is the same as for sequels: the risks are significantly reduced with remakes, you are almost guaranteed to bring back some fanatics of the original.

And less writers are required as the script is already there! However, it appears that sequels are a safer bet: the fan base is more guaranteed. As we previously saw, release dates are much closer for sequels and movies share many more characteristics.

Thursday, August 21, 2014

Originals and Remakes: Who's copying who?

In the previous post ("Are remakes in the producers' interests?"), I compared the IMDB rating of remake movies to that of the original movie. We found that in the very large majority of cases the rating was significantly lower.

One aspect I did not look at was who-copied-whom from a country perspective. Do certain countries export their originals really well to other countries? Do certain countries have little imagination and import remake ideas from oversees movies?


Using the exact same database as for the previous post (approx. 600 pairs of original-remake movies), I created a database which detailed for each country the following metrics:
  • number of original movies it created
  • number of remake movies it created
  • number of original movies it exported (country is listed for the original, not for the remake)
  • number of remake movies it imported (country is not listed for the original, but for the remake)


Top originals
Nothing very surprising with the US claiming the first place for original movies created, with 325 movies for which remakes were made. The next positions are more interesting, with France and India tied for second place with 36, closely followed by Japan with 30.

Top remakes
Again, nothing very surprising with the US claiming the first place again for number of remakes made, with 370. India is again in second position with 38, followed by UK (14) and Japan (10). Surprising to see France (6) in a distant position for this category given it's second place in the previous category.


Top exporters
Who manages to have their originals get picked up abroad the most? The US is in first position again with (49) with France in relatively very close second place with 32. Japan (21) and UK (14) are in third and fourth positions.


Top importers
Who are the biggest copiers? US is way ahead of everyone with 94, with multiple countries tied at 2 (France, UK, Japan...). Recall that UK, Japan and France were all among the top remake countries, the fact that they are low on the import list indicates that these countries tend to do their own in-house remakes instead of looking abroad for inspiration.


It is difficult to look at other metrics , especially in terms of ratios as many countries have 0 for either category. We could filter to only include countries that have at least 10 movies produced, or at least 5 imported and 5 exported, but even so we would be keeping only a handful movies.


France -> US Movie Relationship
France seemed to be an interesting example here given the high number of original movies produced, the fact that many of those were remade abroad and France's tendency of importing very little ideas. I therefore looked at the French-US relationship in matters of movies.
Wikipedia lists 24 original movies made in France for which a US remake was. In 22 cases the remake had a worst rating, and in the other two cases there was some improvement. 2 out of 24 is about 8.3%, somewhat worse than the overall effect for all original-remake pairs where we had seen improvement in 14% of the cases. Similarly, the average decline of 1.35 for IMDB rating is also somewhat worse than the average across all pairs which we had found to be around 1.1.
The worst remake is without a doubt Les Diaboliques, the French classic was Simone Signoret having a rating of 8.2 while the Sharon Stone remake had 5.1. And who would have thought that Arnold Schwarzennegger would have his name associated with the best remake improvement: his 1994 True Lies (7.2) was much better than the original 1991 La Totale! (6.1).


What about the reverse US -> France effect?
Well it turns out that France only made two remakes of US movies which leaves us with little observations for strong extrapolations. However, the huge surprise is that in both cases the French remake had a better IMDB rating than the original american version. 1978 Fingers had 6.9 while the 2005 The Beat that my Heart skipped is currently rated at 7.3. As for Irma la Douce, it jumped from 7.3 to 8.0.
It's hard, if not impossible, to determine if France is better at directing or whether they are better at pre-selecting the right scripts. What makes it even more head-scratching is the fact that out of the 6 remakes France did, the two US originals are the only ones where the remake did better. The other four were already French originals, and in all four cases the remake was worse.


This France-USA re-adaptation dynamics sheds some light as to why the French were extremely disappointed to hear about Danny Boon signing off rights to his record-breaking Bienvenue chez les Chti's to Will Smith for a Welcome to the Sticks remake. But as always, IMDB ratings are not the driving force at work here, and if Bienvenue chez les Chti's broke attendance and revenue records in France, it could prove to be a cash cow in the US without challenging being a big threat at the Oscars.


Should more cross-country adaptation be encouraged?
The France example should make us pause. 6 remakes. 4 original French movies, all rated worse when remade. 2 original US movies, all rated better when remade.
Is this a general trend?
I split the data in two, one subset where the country for the original and remake are the same (~80% of the data), and another subset where they are not (~20% of the data).
Here are the distributions for the rating difference between remake and original:


The two distributions are very similar, but it still seems that the rating drop is not as bad when the country of origin is the one making the remake than when another country takes the remake into its own hands.
Given the proximities in distributions, a quick two-sample t-test was performed on the means and the difference turns out to be borderline significant with a p-value of 0.0542.
Arguments could go both ways as to whether the remake would have higher rating if done by the same country or another one: movies can be very tied to the national culture and only that country would be able to translate the hidden cultural elements into the remake to make it successful. But one could argue that the same country would be tempted to do something too similar which would not appeal to the public. A foreign director might be inspired and want to bring a new twist to the storyline bring a different culture into the picture.

Looking back at France that does much better adapting foreign movies unlike the rest of the world, we have here witnessed another beautiful case of the French exception!

Tuesday, July 8, 2014

World Cup: Don't get all defensive!


Saying that the 2014 World Cup is currently underway in Brazil is as obvious as statements come. Even if you're not a huge soccer fan (heck, even if you hate soccer!) it's everywhere, ads, fan tweets, TV results, schedules, preferred links, friends' Facebooks updates with posts as insightful as "Go [insert country name] !![adapt number of exclamation points based on time until next game]".

Given that half of my posts on this blog so far have dealt with NBA basketball you've probably guessed what sport I typically tune in to. But the NBA Finals are over ("Go Spurs!!!!"), and I have to admit I got somewhat caught up in the World Cup excitement.


I have only watched one game from start to finish, but have kept track of results and scores (like everyone on Earth there is a world cup pool going on at work), and something stood out: the first few games were rather exciting (aka high-scoring) (I would sit for short periods of time through games and almost always caught a goal). But the past few games have actually been more on the boring (aka low-scoring) side. Again, associating the number of goals to excitement is quite a shortcut, but I don't know enough of soccer to appreciate the strategic subtleties in a game ending at 0-0 (remember I come from the basketball world were scores average 100). But forget the excitement, is there real a drop in goals scores or is this just a fluke?

Quick soccer recap for the non-experts like me (from Wikipedia):
The current final tournament features 32 national teams competing over a month in the host nation(s). There are two stages: the group stage followed by the knockout stage.
In the group stage, teams compete within eight groups of four teams each. Each group plays a round-robin tournament, in which each team is scheduled for three matches against other teams in the same group. This means that a total of six matches are played within a group.
The top two teams from each group advance to the knockout stage. Points are used to rank the teams within a group. Since 1994, three points have been awarded for a win, one for a draw and none for a loss (before, winners received two points).
The knockout stage is a single-elimination tournament in which teams play each other in one-off matches, with extra time and penalty shootouts used to decide the winner if necessary. It begins with the round of 16 (or the second round) in which the winner of each group plays against the runner-up of another group. This is followed by the quarter-finals, the semi-finals, the third-place match (contested by the losing semi-finalists), and the final.


My naive observation was that scores in the first stage (group stage) were typically higher than in the second stage (knockout stage).
Let's look at the numbers for the 2014 World Cup:

First stage:

  • Average Goals: 2.833
  • First quantile: 1
  • Median: 3
  • 3rd quantile: 4
  • Max: 7

Second stage:

  • Average Goals: 1.917
  • First quantile: 1
  • Median: 2
  • 3rd quantile: 3
  • Max: 3

I won't run any statistical test to look into the difference, but even the worst (best?) devil's advocate will agree that goal production has gone down. The most reasonable explanation is that group stage games don't automatically eliminate you from the competition, everyone is guaranteed three games, so there is a little less pressure to win as opposed to the knockout stage where it is win-or-go-home to use the famous NBA wording. Also, as the competition progresses, the teams get better, it's harder to score 8 goals on your opponent.

But one could have made the case that scores in the knockout stage should have been higher on average: recall that draw (any other sport calls this a tie) are acceptable in the group stage, but a winner is required in the knockout stage and so extra time is added in case of a draw after regular time. The need to break the draw and provide extra time should theoretically generate higher scores.

But is this drop specific to this world cup or has it always been the case? If we break out the scores by stage, does the trend continue with scores getting lower and lower throughout the tournament? Let's look at the evolution of scores for the World Cups from 1990 onwards, broken out by stage:

No strong trends surface from the graph, other World Cups share the same strong decline through the first stages (2002, 2006), but others had increases throughout the same phases of the tournament, as recently as the 2010 World Cup.

Life is full of ironies: as I am writing this post, Germany is leading Brazil 5-0 at the half of the first semi-finals! So much for teams focusing more and more on defense....

So, enough pessimism, the tournament doesn't necessarily generate less goals throughout the tournament, crazy things can happen anytime. Some will say it's the beauty of the sport!

Oh, and based on the graphs, I predict two goals in the Finals....

Thursday, April 17, 2014

Infographic: Fight for the Eastern Conference #1 Seed

All season-long, Indiana set the #1 seed as their objective. While the Pacers completely dominated the first half of the season, they crumbled after the All-Star break (at the same time that Miami and Oklahoma) letting San Antonio capture the overall seed.

But while the overall top seed slipped through their fingers, keeping their grasp on the #1 Eastern conference seed against Miami was a nail-bitting battle till the last few games of the season.

The following infographics show which team had the best winning percentage throughout the regular season. The line is blue when Indiana has the best percentage, red when Miami had it.


Overall season evolution:


Since the All-Star break:


From a 'Ganes Behind' perspective:


Thursday, April 10, 2014

Best of the West or best of the rest?

The NBA finals are right around the corner. Only a handful of games are left to be played in this 2013-2014 season, and homecourt advantage is still a hard fought battle for the top teams.


Miami wants it to increase their odds of winning a third straight championship, Indiana wants it to turn the tables if (more like when) it meets Miami in the Eastern conference finals and avoid a game 7 in Miami like it did last year, San Antonio wants it for the exact same reason except it lost to Miami in game 7 of the finals, and OKC wants it in case it faces Miami in the finals (plus it could provide Kevin Durant with an additional edge on the MVP race against LeBron James).

So yes, everyone wants homecourt advantage, it's been proved over and over again (including in this blog) that there is a definitive advantage to playing 4 games instead of 3 at home in the best-of-7 format. But how key is it really? Does homecourt advantage really determine the NBA champions? Do other factors such as the conference you are in or the adversity faced in the first rounds play a part?

Following on the tradition of the past years, the West is clearly better than the East. Consider this: right now, the Phoenix Suns hold the eighth-best record in the West with 46 wins and 31 losses, and has the last seed for the playoffs. But only two teams have a better record than that in the East, Miami and Indiana. Stressing to hold the last playoff spot in one conference versus a comfortable third seed in the other? Talk about disparity!

But if you had to guess whether the next champ was going to be from the East or West what would you say? That the eastern team would have an easier road to the finals, less games, less fatigue than their western counterpart? Or does evolving in a hyper-competitive bracket strengthen you, in a what-doesn-t-beat-you-makes-you-stronger argument?


Does the overall strength conference have an impact? Does the team with the best regular season record (and hence homecourt advantage) necessarily win? Does the team with the easiest path to the finals have an advantage?

To investigate this I've looked at all championships since 1990 (24 Playoffs) and looked in each case at some key stats for the two teams battling for the Larry O'Brien trophy, among these:
  • number of regular season wins
  • regular season ranking
  • sum of regular season wins for opponents encountered in the Playoffs
  • sum of regular season ranking for opponents encountered in the Playoffs
  • number of games played to reach the Finals
  • sum of regular season wins for all other Playoffs teams in their respective conferences
  • sum of regular season ranking for for all other Playoffs teams in their respective conferences
  • ...

So for Miami in 2013, the data would look something like:
  • 66 regular season wins
  • NBA rank: 1
  • played 16 games before reaching the Finals
  • 132 playoff opponent regular season wins (Indiana: 49, Chicago: 45, Milwaukee: 38)
  • 38.5 playoff opponent regular NBA ranking (Indiana: 8.5, Chicago: 12, Milwaukee: 18)
  • 320 playoff conference regular season wins (Indiana: 49, New York: 54, Chicago: 45, Brooklyn: 49, Atlanta: 44, Milwaukee: 38, Boston: 41)
  • 84.5 playoff opponent regular NBA ranking (Indiana: 8.5, New York: 7, Chicago: 12, Brooklyn: 8.5, Atlanta: 14 Milwaukee: 18, Boston: 16.5)
  • ...
As for the Spurs who were the other 2013 finalists, they had a worse record, emerged from a tougher conference and met stronger opponents while needing surprisingly less games to reach the Finals:
  • 58 regular season wins
  • NBA rank: 3
  • played 14 games before reaching the Finals
  • 148 playoff opponent regular season wins (LA Lakers, Golden State, Memphis)
  • 27.5 playoff opponent regular NBA ranking (LA Lakers, Golden State, Memphis)
  • 366 playoff conference regular season wins (Memphis, Oklahoma, Golden State, Denver, Houston, LA Lakers, LA Clippers)
  • 51 playoff opponent regular NBA ranking (Memphis, Oklahoma, Golden State, Denver, Houston, LA Lakers, LA Clippers)
  • ...


I then ran various models (simple logistic regression, and lasso logistic regression) to see how these different metrics helped predict who would win the champion come the Finals.

The conclusions confirmed our intuition:
  • having more regular season wins that your opponent in the Finals provides a big boost to your chance of winning (namely by securing homecourt advantage, but the exact number of games provided a much better fit than a simple homecourt advantage yes/no variable)
  • there were indications that having a tougher path to reach the finals (more games, tougher opponents) slightly reduced the probability of winning the championship, but none of those effects were very significant

The effect from difference in regular season wins can be seen on the following graph, where we have compared two (almost) identical teams evolving in identical conferences. The only difference between the two teams is the number of wins they've had in the regular season, shown on the x-axis. The y-axis shows the probability of winning the championship.


A five-game differential in wins will translate with a 73% / 27% advantage to the team with the most wins. Only a one-game advantage translates into a 55% / 45% advantage.

The conference effect appears quite minimal, and home-court advantage appears to be key. If Indiana hates itself right now for having let the number 1 seed in the East slip through its fingers, it can always try to comfort itself with the fact that (unless a major San Antonio / Oklahoma / LA Clippers break down occurs over the remaining games of the season), the Western team making it to the Finals would have held homecourt advantage no matter what.

It should also be noted that a "bad" conference isn't synonym of easy opponents. Just look how Brooklyn seems to have the Heat's number this year, the way Golden State had Dallas' in 2007 when it beat the number 1 seed in the first round. All season long the Golden State Warriors were the only ones who could match up against Dallas really well.

UPDATE: as of yesterday, Indiana has reclaimed the top seed in the East, but the final argument can be applied to Miami just as well. Whichever of these teams makes it to the Finals will face a tough opponent.


Friday, February 14, 2014

Easy tips for Hollywood Producers 101: Cast Leonardo DiCaprio! (but cast him quick!)

My wife and I were thinking of going out to see "The Wolf of Wall Street" the other day. Why did this movie catch our eye more than the other twelve or such showing at our local movie theatre?


Had we heard great reviews about it? Nope. Had word-of-mouth finally reached us? Nope. Had we fallen prey to a cleverly engineered marketing campaign? Well yes and no.

Not owning a TV at home, so the least you could say is that our TV ad exposure was quite minimal. And as far as I can remember (although one could argue that this is exactly the purpose of sophisticated inception-style marketing) we din't see that many out-of-home ads nor hear any radio ones. Marketing was involved, but the genius of the marketers behind "The Wolf of Wall Street" was restricted to creating the poster, and not because of the monkey in a business suit nor the naked women, but simply by putting Leonardo DiCaprio right there. My wife and I's reasoning was simply that any movie with Leonardo had to be good.

Now don't go and write us off as Titanic groupies/junkies. I won't deny we both enjoyed that movie, but we don't have posters of him plastered all over our house. But here's the question we found ourselves asking: Can you name a bad movie with Leonardo in it? And harder yet: a bad recent movie with him in it?

Made you pause for a second there didn't it? Few people will argue against the fact that Leonardo is a very good actor and that his movies are generally pretty darn good. But are we being totally objective here? How does Leonardo's filmography compare to that of other big stars? The Marlon Brandos, Al Pacinos, De Niros, Brad Pitts...?

In order to compare actors' filmographies, I turned to my favorite database from IMDB. IMDB has a rather peculiar way of listing actors, directors, producers in its database, and I was unable to find a logic between the individual and the index in the database. But I did notice that all the big actors I wanted to compare Leonardo to had a low index (never above 400), so decided to pull data for all indices less than 1000. Now in the process I got some directors or actors with very few movies, so excluded from the analysis anybody have acted in less than 10 movies. The advantage of pulling this way was the fact that it provided a very wide range of diversity in gender, geography and time. So we have Fred Astaire, Marlene Dietrich, Louis de Funès, Elvis Presley...And to get an even broader picture, I added 30 young rising new stars to the mix. All in all, 826 actors to compare Leonardo to.

Going back to our original question of how good Leonardo is, I've looked at two simple metrics: ratio of movies with an IMDB rating greater than 7, and ratio of movies with an IMDB greater than 8. So how well did Leonardo do? The mean fraction across the actors was 22% for the 7+ rating (median 20%). Leonardo had... 55%! That's 16 out of his 29 movies! Only 15 actors have a higher score. Top of the list? Bette Davis, with 76 of her 91 movies (83.5% having a 7+ rating). The recently deceased Philip Seymour Hoffman also beat Leonardo with 31 out of 52 (59.6%). Fun fact, what male actor of all times has the best ratio here? You have to think out of the box for this one as he's more famous for directing than acting, yet makes an appearance in almost every one of his movies. That's right, Sir Alfred Hitchcock, has 28 of 36 movies (77.8%) rated higher than 7.

Name Number of movies Number of 7+ movies Ratio of 7+ movies
Bette Davis 91 76 83.5%
Alfred Hitchcock 36 28 77.8%
François Truffaut 14 10 71.4%
Emma Watson 14 10 71.4%
Bruce Lee 25 16 64.0%
Terry Gilliam 16 10 62.5%
Andrew Garfield 13 8 61.5%
Alan Rickman 44 27 61.4%
Frank Oz 31 19 61.3%
Daniel Day-Lewis 20 12 60.0%

What about for movies rated higher than 8? Leonardo does even better according to this metric! The average actor has only 2.7% (median 1.7%) of movies with such a high rating. Leonardo has 5 out of 29, 17.2%! And only 8 actors do better with this metric. No more Bette Davis (plummets to 3.2%), but replaced by Grace Kelly (3 out of 11, 27.3%) who tops the chart. Sir Alfred is impressive once again with 9 out of 36 (25%).

Name Number of movies Number of 8+ movies Ratio of 8+ movies
Grace Kelly 11 3 27.3%
Alfred Hitchcock 36 9 25.0%
Anthony Daniels 12 3 25.0%
Chris Hemsworth 12 3 25.0%
Terry Gilliam 16 3 18.8%
Elizabeth Berridge 11 2 18.2%
Elijah Wood 56 10 17.9%
Groucho Marx 23 4 17.4%
Leonardo DiCaprio 29 5 17.2%
Quentin Tarantino 24 4 16.7%

Now the big stars we mentioned earlier do pretty well, just not as good as Leonardo:

Name Number of movies Number of 7+ movies Number of 8+ movies Ratio of 7+ movies Ratio of 8+ movies
Marlon Brando 40 18 4 45.0% 10.0%
Brad Pitt 48 23 6 47.9% 12.5%
Robert De Niro 91 32 8 35.2% 8.8%
Leonardo DiCaprio 29 16 5 55.2% 17.2%
Clint Eastwood 59 19 6 32.2% 10.2%
Morgan Freeman 69 24 7 34.8% 10.1%
Robert Downey Jr. 68 17 1 25.0% 1.5%

Another thing worth repeating to put these numbers in perspective: we are not comparing Leonardo to your "average" Hollywood actor. Because of the way IMDB has matched actors with indices, we are comparing Leonardo to some of the greatest of all times here!

Remember how earlier one we mentioned that it was even harder to find a recent bad movie by Leonardo? Let's look at his movie ratings over time to confirm this impression:


Wow. With the exception of J.Edgar in 2011, every single one of his movies since 2002 (that's over this last decade !) has had a rating greater than 7! 12 movies!

Now one might argue that there is a virtuous circle here: the more you become a star, the easier it is to get scripts and parts for great movies and do the easier it becomes to continue being a super star. For each actor in my dataset, I ran a quick linear regression to see improvement of movie rating over time. Leonardo stands out here quite a bit too, for he is among the rare actors to have positive improvement. The "average" actor's movie lose 0.01 IMDB rating points per year, Leonardo gains 0.1 per year, putting him in the top 15 of the data set:

Name Number of movies Number of 8+ movies Number of 7+ movies Improvement
Taylor Kitsch 11 1 2 0.26
Rooney Mara 11 1 4 0.26
Justin Timberlake 18 0 3 0.23
Chloe Moretz 24 1 6 0.19
Bradley Cooper 26 0 7 0.18
Juliet Anderson 50 1 12 0.17
Mila Kunis 23 1 3 0.16
Chris Hemsworth 12 3 7 0.15
Tom Hardy 27 3 12 0.14
Andrew Garfield 13 0 8 0.12
Mia Wasikowska 21 0 9 0.12
Barbara Bain 14 1 2 0.11
George Clooney 38 1 15 0.11
Jason Bateman 32 2 9 0.11
Leonardo DiCaprio 29 5 16 0.10

What's quite surprising in the last table is that those topping the list in terms of year over year improvement are not the old well-established actors having great choice in scripts, but the new hot generation in Hollywood!

What happens to the megastars? Well let us look at the rating evolution of some of these stars:

Fred Astaire:

Marlon Brando:

Bette Davis:

It appears that they all go through some glory days. Remember Leonardo with his 12 years of 12 movies greater than 7 aside from J. Edgar? Well Bette Davis had 46 such movies, without any exceptions, over a span of 29 years! But not a great way to end a career... Same goes for Fred Astaire and Marlon Brando, started off doing well but end of careers are tough even for big stars, or might I say especially for big stars. Naturally, the hidden question is whether ratings of later movies go down because actors aren't as good as they were, or because good roles don't come as much, because they only get casted for grumpy grandparents in bad comedies. Correlation vs causation...

So back to Leonardo. He's still young, so the primary impulse my wife and I had of "Leonardo's in it so it's got to be good" was not completely irrational, but it might be in 5/10 years from now. Same goes for all the rising top stars. Cast them while they're hot, cause nothing is eternal in Hollywood.