Then came the TV series revolution, with more sophisticated scripts, each episode becoming less of an independent unit but one of the many building blocks in the narration of ever increasing complex plots. Skipping episodes was no longer an option, even more so given the cliffhanger of the last episode.
The first such series I remember were 24 and Lost.
I'm not going to list all my favorite shows, nor try to compare them or do any advanced analyses. I just wanted to share some visuals I created allowing quick summarization of the quality of a series, episode after episode, season after season.
Here is the visual for Friends:

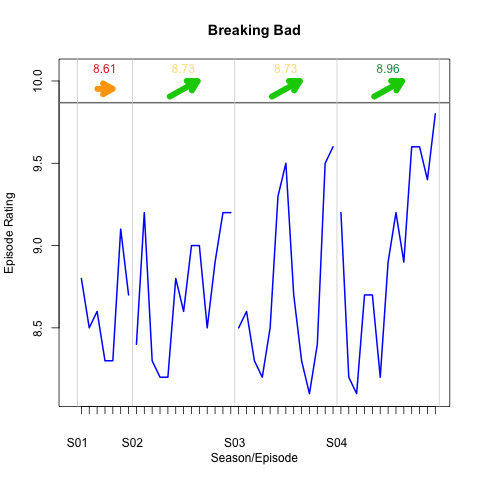
- the number at the very top is the average of the IMDB rating for all the episodes of the season. The color on a red-green scale compares the seasons to each other: the seasons with highest averages are green, those with worst ratings are red.
- the arrow under the season average represents the evolution of ratings within the season: if episodes tend to get better and better the arrow will point upwards and be green, if they get worse the arrow will point downwards and be red. If the ratings remain approximately average over the season a horizontal orange arrow is displayed.
Revisiting the Friends visual, we observe spectacular consistency in ratings over the ten-year period. The summaries on top allow us to see through the noise, and that seasons 8 and 9 were among the worst in average episode rating as well as the only two that got worse over the season. But the tenth and final season was the highest-rated one, and had a strong positive trend until the series finale.
Although not a huge fan, I had to look at the Simpsons' incredible run. The visual highlights the surprising drop and plateau of the season average starting around the ninth season.

Now looking at some of my favorite series:


Great post..!! Enjoy more original film scripts, TV show scripts and production scripts from some of the best television cartoons of all times. Enjoy freshly-printed TV series scripts from high-quality digital files.
ReplyDelete