Showing posts with label movies. Show all posts

Friday, August 30, 2019

Disney vs Fox: Movie Performance Comparison

A few weeks ago 'Dark Phoenix' was a very hot conversation topic in the movie business, not for the movie itself, but because it symbolized the difficult Fox acquisition by Disney.


While Disney movies have done fairly well in 2019 to put it lightly (5 movies generating over $1Billion so far, and it's only August with "Frozen 2" and "Star Wars 9" still due....), Fox is under very tight scrutiny and 'Dark Phoenix' has been heralded as the barometer for Fox movie success/failure. Especially after Disney CEO Bob Iger declared during quarterly earnings call that “the Fox studio performance … was well below where it had been and well below where we hoped it would be when we made the acquisition.

While technically profitable thanks to higher-than-expected international results (latest IMDB results have $250M gross worldwide revenue with analyst forecasts around $280M for an estimated budget of $200M), 'Dark Phoenix''s performance will continue to be observed and scrutinized.

But this is just one movie we're talking about! Is it really fair to reduce a movie studio the size of Fox to a single movie? 20th Century Fox has been around for a while, and I was curious to compare their historical performance compared to Disney's.
Image result for data data data

First things first, data is required! I pulled all of Disney's and Fox's movies from IMDB, including key metrics in the process: IMDB rating, metascore, duration, genre, estimated budget, gross revenue...

Naturally some filtering was required to focus solely on non-short non-documentary movies released after 2000 with non-missing data.

In addition to Fox and Disney movies, I created a third category for movies produced by both.

The next plot compares the performance of each of the 512 movies that matched are criteria (331 Fox, 181 Disney), the x-axis is the worldwide revenue, y-axis is IMDB rating. Bubbles are color-coded by company and the size of the bubble is proportional to the movie's ROI (gross worldwide revenue / estimated budget):


A log-transform of the x-axis provides more insight into the lefthand-side blob, but loses the magnitude of the super high-performing movies:


It would appear that Disney dominates the high revenue end of the spectrum, with 22 out of 23 of movies generating over a billion dollars coming from Disney, the sole exception being 'Transformers: Age of Extinction', things are much more murky under that threshold.

Given the difficulty of separating the two classes I tried fitting an XGBoost model which was capable of classifying movies from each company solely based on IMDB rating, metascore, budget, world revenue and movie duration with over 75% accuracy on the test dataset, pretty remarkable, wouldn't you agree? Although to be fair, a simple logistic regression was capable of achieving a reasonable 65% accuracy.

It'll be interesting to see how the next wave of Fox movies perform, perhaps attempt a before/after comparison of the Disney acquisition...

Image result for avatar 2


Tuesday, December 22, 2015

2015 Summer Blockbuster review

Summertime rhymes with school break, fireworks, BBQ, but just as inseparable are Hollywood's big blockbusters. Early 2015, even as early as late 2014 we had teasers and trailers for the big upcoming wave of big budget movies, many of which sequels to blockbuster sagas. Terminator 5, Jurassic Park 4 anyone?

Starting early summer I pulled daily stats for 20 of the most anticipated summer movies of 2015, and before we enter the new year, let's see how they did.

Rating Evolution

In these two earlier posts I looked at the evolution IMDB scores after movies' releases, as well as after Game of Thrones episodes aired. In both cases we observed a trend in rating decrease as time went by, although this phenomenon was much more sudden for TV episodes (a few days) than for movies (multiple weeks / months).

Here's the trend for our 20 blockbusters, all aligned according to release date, and titles ordered according to final rating:


Again, we observe the same declining trend, although the asymptote seems to be reached much sooner than for the average movie (earlier analysis).

Straight Outta Compton clearly emerges as the best-rated movie of the summer although it did not benefit from as much early marketing as most of its competitors. Straight Outta Compton also distinguishes itself from the other movies in another way. While all movies dropped an average of 0.3 rating points between release date and latest reading (not as dramatic as the 0.6 drop observed across a wider range of movies in the previous analysis already mentioned, as if summer blockbuster movies tend to decrease less and stabilize faster), Straight Outta Compton actually improved its rating by 0.1 (this is not entirely obvious from the graph, but the movie had a rating of 8.0 on its release date, jumped to 8.4 the next day, and slowly decreased to 8.1). Only two other movies saw their ratings increase, Trainwreck from 6.2 to 6.5 and Pixels from 4.8 to 5.7, the latter increase while quite spectacular still falls way short from making the movie a must-see, despite the insane amounts spent on marketing. As you might have noticed from my posts, my second hobby is basketball, and I remember this summer when not a day would go by without seeing an ad for Pixels on TV or on websites where NBA stars battled monsters from 1970 arcade games.

Which brings us to the next question: did budget have any effect on how well the movies did, either from a sales or rating perspective? Of course we are very far from establishing a causal model here so we will have to satisfy ourselves with simple correlations across five metrics of interest: IMDB rating, number of IMDB voters, movie budget, gross US sales and Metascore (aggregated score from well-established critics).


I would have expected the highest correlation to be between IMDB rating and Metascore (based on another analysis I did comparing the different rating methodologies). However, it came at second place (0.73) and I honestly had not anticipated the top correlation (0.87) between budget value and number of IMDB voters. Of course we can't read too much into this correlation that could be completely spurious, but it might be worth confirming again later with a larger sample. If I had to give a rough interpretation though, I would say that a movie's marketing spend is probably highly positively correlated with the movie's budget. So the higher the budget, the higher marketing spend and the stronger 'presence of mind' this will have on users who will be more likely to remember to rate the movie. Remember my example of all the Pixels ads? I didn't see the movie, but if I had, those ads might have eventually prompted me to rate the movie independently of how good it was, especially if those ads appeared online or even on IMDB itself.

But while we wait for that follow-up analysis, we can all start looking at the trailers for the most anticipated movies of next year, sequels and reboots leading the way once again: X-Men, Star Trek, Captain America, Independence Day...


Saturday, December 5, 2015

Is this movie any good? Figuring out which movie rating to trust

In October, FiveThirtyEight published a post cautioning us when looking at movie reviews "Be Suspicious Of Online Movie Ratings, Especially Fandango’s".

To summarize the post as concisely as possible, Walt Hickey describes how Fandango inflates movie scores by rounding up, providing the example of Ted 2 which, despite having an actual score of 4.1 in the page source, displays 4 and a half stars on the actual page. The trend is true across all movies, a movie never had a lower score displayed, and in almost 50% of cases displayed a higher score than expected.

So if Fandango ratings aren't reliable, it could be worth turning to another major source for movie ratings: the Internet Movie Database IMDB.

Pulling all IMDB data, I identified just over 11K movies that had both an IMDB rating (provided by logged-in users) and a Metascore (provided by metacritic.com, aggregating reviews from top critics and publications). The corresponding scatterplot indicates a strong correlation between the two:


In these instances, it is always amusing to deep-dive into some of the most extreme outliers.
To allow for fair comparisons across both scales (0-100 for Metascore, 0-10 for IMDB), we mapped both scales to the full extent of a 0-100 scale, by subtracting the minimum value, dividing by the observed range, and multiplying by 100.
So if all IMDB ratings are between 1 and 9, a movie of score 7 will be mapped to 75 ((7 - 1) / (9 - 1) * 100).

Here are the movies with highest discrepancies in favor of Metascore:
Movie Title IMDB Rating Metascore Genre IMDB (norm) Metascore (norm) Delta
Justin Bieber: Never Say Never 1.6 52 Documentary,Music 7.2 51.5 -44.3
Hannah Montana, Miley Cyrus: Best of Both Worlds Concert 2.3 59 Documentary,Music 15.7 58.6 -42.9
Justifiable Homicide 2.9 62 Documentary 22.9 61.6 -38.7
G.I. Jesus 2.5 57 Drama,Fantasy 18.1 56.6 -38.5
How She Move 3.2 63 Drama 26.5 62.6 -36.1
Quattro Noza 3.0 60 Action,Drama 24.1 59.6 -35.5
Jonas Brothers: The 3D Concert Experience 2.1 45 Documentary,Music 13.3 44.4 -31.2
Justin Bieber's Believe 1.6 39 Documentary,Music 7.2 38.4 -31.2
Sol LeWitt 5.3 83 Biography,Documentary 51.8 82.8 -31.0
La folie Almayer 6.2 92 Drama 62.7 91.9 -29.3

And here are the movies with highest discrepancies in favor of IMDB's rating:
Movie Title IMDB Rating Metascore Genre IMDB (norm) Metascore (norm) Delta
To Age or Not to Age 7.5 15 Documentary 78.3 14.1 64.2
Among Ravens 6.8 8 Comedy,Drama 69.9 7.1 62.8
Speciesism: The Movie 8.2 27 Documentary 86.7 26.3 60.5
Miriam 7.2 18 Drama 74.7 17.2 57.5
To Save a Life 7.2 19 Drama 74.7 18.2 56.5
Followers 6.9 16 Drama 71.1 15.2 55.9
Walter: Lessons from the World's Oldest People 6.4 11 Documentary,Biography 65.1 10.1 55.0
Red Hook Black 6.5 13 Drama 66.3 12.1 54.1
The Culture High 8.5 37 Documentary,News 90.4 36.4 54.0
Burzynski 7.4 24 Documentary 77.1 23.2 53.9


Quickly glancing through the table we see that documentaries are often the cause of the biggest discrepancies one way or another. IMDB is extremely harsh with music-related documentaries, Justin Bieber has two "movies" in the top 10 discrepancies. Further deep-diving in those movies surfaces some interesting insights: For those movies, approximately 95% of voters gave it either a 0 or 10, and the remaining 5% a score between 1-9. Talk about "you either love him or hate him!". Breaking votes by age and gender, provides some additional background for the rating: independently of age category, no male group gave Justin a higher than 1.8 average, whereas no female group gave less than a 2.5. As expected, females under 18 gave the highest average score 5.3 and 7.8 respectively for each movie, but with 4 to 5 times more male than female voters, the abysmal overall scores were unavoidable.

OK, I probably spent WAY more time than I would have liked discussing Justin Bieber movies...

Let's look at how these discrepancies vary against different dimensions. The first one that was heavily suggested from the previous extremes was naturally genre:

We do see that Documentaries have the widest overall range, but all genres including documentaries actually have very similar distributions.

Another thought was to split movies by country. While IMDB voters are international, Metascore is very US-centric. So for foreign movies, voters from that country might be more predominant in voting and greater discrepancies observed when comparing to US critics. However, there did not seem to be a strong correlation between country and rating discrepancy.

We do observe a little more fluctuation in the distributions when splitting by country rather than genre, but all distributions still remain very similar. The US has more extremes, but this could also be due a result from the fact that the corresponding sample size is much larger.

As a final attempt, I used the movie's release date as a final dimension. Do voters and critics reach a better consensus over time and do with see a reduced discrepancy for older movies?

The first thing that jumps out is the strong increase in variance of the delta score (IMDB - Metascore). Similarly to the United States in the previous graph, this is also most likely a result from sample size. While IMDB voters can decide to vote for very old movies, Metacritic doesn't have access to reviews from top critics in 1894 to provide Carmencita with a Metascore (although I'm not sure it would be as generous as the IMDB score of 5.8 for this one minute documentary of a movie whose synopsis is: 'Performing on what looks like a small wooden stage, wearing a dress with a hoop skirt and white high-heeled pumps, Carmencita does a dance with kicks and twirls, a smile always on her face.')

But the more subtle trend is the evolution of the median delta value. Over time, it seems that the delta between IMDB score and Metascore has slowly increased, from a Metascore advantage to an IMDB advantage. From a critics perspective, it would appear as if users underrated old movies and overrated more recent ones. However the increase in trend has stabilized when we entered the 21st century.

I couldn't end this post without a mention to Rotten Tomatoes, also highly popular with movie fans. While Metacritic takes a more nuanced approach to how it scores a movie based on the reviews, Rotten Tomatoes only rates it as 0 (negative review) or 1 (positive review) and takes the average. In his blog post, Phil Roth explores the relationship between Metascores and Rotten Tomatoes and, as expected, finds a very strong relationship between the two:


So to quickly recap, there is clearly a strong correlation between the two ratings, but with enough variance that both provide some information. For some people, their tastes might better align with top critics whereas others might have similar satisfaction levels as their peers. Personally, I've rarely been disappointed by a movie with an IMDB score greater than 7.0, and I guess that I'll continue to use that rule of thumb.

And definitely won't check Fandango.


Thursday, July 23, 2015

Love at first sight? Evolution of a movie's rating

Every day, over 3 million unique visitors go to imdb.com and I am very often one of those. With limited time to watch movies, I heavily rely on IMDB's ratings to determine whether a movie is a rental or theatre go/no-go.


My memory is sufficiently bad that I sometimes need to check a new release's rating a few days apart, but sufficiently good that I can remember rating changes. The most common scenario consists of me checking a whole bunch of ratings for different movies, then trying to talk my wife into going to see the one I like best, using IMDB's rating as an extra argument. She'll systematically - and skeptically - ask for the movie's rating (she's also part of the daily 3 million). And I'll say it's really good, something like 8.3, here let me show you... and a 7.4 appears on my screen and I look like a fool.


Of course, it's completely expected that IMDB ratings would evolve, and even more so when the movies have recently released and have few voters: I fully anticipate Charlie Chaplin's City Lights to still have an 8.6 rating a month from now, but don't think Ted 2 will still have a 7.2 next month, or even when this post gets published! But the question I had was how do movie ratings evolve? How long does it take them to reach their asymptotic value? Are movies over- or under-rated right around their release date? It would seem reasonable that people would have a tendency to overestimate new movies they just saw at the movie theatre. The bias is due to the fact that if they made the effort of going to see the movie shortly after it's release they were probably anticipating it would be worth their money and time. Therefore, they might overrate the movie after seeing it independently of its quality to remain coherent with their prior expectations ('coherency principle' in psychology).
An internet blogger by the name of Gary didn't really phrase it as such, taking the approach of insulting people who bumped 'Up' to the 18th position of best all-time movies in IMDB. A fun read.

To monitor rating evolution, I extracted daily IMDB data up until 2015 data for 22 different movies released in 2012: Branded, Cloud Atlas, Cosmopolis, Dredd 3D, Ice Age: Continental Drift, Killing Them Softly, Lincoln, Paranormal Activity, Paranorman, Rec3: Genesis, Resident Evil Retribution, Rise of the Guardians, Savages, Skyfall, Sparkle, The Big Wedding, The Bourne Legacy, The Dark Knight, The Expendables, The Words, Total Recall and Twilight: Breaking Dawn 2.

For each movie I recorded three maun metrics of interest: IMDB rating, the number of voters and the metascore (from metacritic.com which aggregates reviews to generate a unique rating out of 100 for movies, TV series, music and video games).

Here's an example of the data plotted for The Dark Knight:

Originally rated 9.2, it dropped to 8.8 in the first month, then dropped a little more to 8.6 after 6 months where it appears to have stabilized. I just checked and it seems to have dropped an additional 0.1 point, now at 8.5 three years after release. Let's now look at the number of people who voted for it:


The number of voters rapidly increased right after the release, and although it isn't increasing as fast afterwards, many people continue to vote for it. This curve is quite typical across all movies.

Finally, let's look at the metacritic score:

I'm not sure we can even talk about a curve here. Momentarily rated 85, metascore dropped to 78 at release and hasn't changed to this date. This is perfectly normal as the metascore is based on a small sample of official critics ('Hollywood Reporter', 'Los Angeles Times', 'USA Today'). Reviews are released around the same time the movie is, no critic is going to be reviewing the Dark Knight Rises today which is why metascores are so stable.

Ignoring the y-axes, the shape of the curves are quite similar across movies, though there are some outliers worth showing.

Increasing IMDB rating? Most movies seem to get overrated at first and stabilize to a lower asymptotic rating. But in certain cases we see the rating increase after the release, as seen here with The Big Wedding with Robert De Niro and Diane Keaton:


Still with The Big Wedding, staggered worldwide release dates are clearly highlighted from the shape of the number of voters.

Based on our small sample can we estimate the overestimation of a movie's rating when it is released. After how many months does the rating stabilize?

Combining the data for all the movies together and aligning them based on their release date (thus ignoring and seasonal effects), we obtain the following graph where the x-axis is weeks since release:


We see a steady decline in rating by about 0.6 points over a period of about 7 months. A more surprising phenomenon is the upward trend in ratings that starts about a year after the original release. The trend seems quite strong, however we should keep in mind
that our original sample size of movies was small (22), and we only have data beyond 75 weeks after release for a handful of those movies, so the upward trend on the very right could be completely artificial and a great example of overfitted data!

A similar break in trend occurs for the number of voters:


As for the metascore, it appears remarkably stable right after release for the reasons already mentioned previously.


In a nutshell, movies do appear to be very slightly overestimated at release time (assuming the long-term asymptote is a movie's "true" rating), and the difference in rating (approximately 0.3 between the first month and months 2 through 6) was small yet significant (based on a paired t-test).

So if you do use IMDB to help your movie selection, definitely keep in mind that while the movie is probably good, it most likely isn't as good as 'Up'.

Tuesday, October 7, 2014

Are remakes in the producers' interests?

Two-bullet summary:

  • Similarly to sequels, remakes perform significantly worse than originals from a rating perspective
  • If you want to predict a remake's IMDB rating, a quick method is to multiply the original movie's rating by 0.84


In three previous posts (first, second, third) I looked at Hollywood's lack of creation and general risk-aversion by taking a closer look at the increasing number of sequels being produced despite the fact that their IMDB rating is significantly worse than the original installment.

We were able to confirm the expected result that sequels typically have worse ratings than the original (only 20% have a better rating), and the average rating drop is 0.9.


Those posts would not have been complete without looking at another obvious manifestation of limited creativity: remakes!

Before plunging into the data, a few comments:

  • finding the right data was instrumental. Because remakes don't necessarily have the same title or because movies may have the same title without being remakes, the data needed to be carefully selected. I finally settled for Wikipedia's mapping Wikipedia. I did however find some errors along the way so bear in mind that the data is not 100% accurate nor exhaustive;
  • one of the greatest drops in ratings was for Hitchcock's classic Psycho (there should be a law against attempting remakes of such classics!), with Gus Van Sant's version getting a 4.6, compared to Hitchcock's 8.6;
  • adapting Night of the Living Dead to 3D saw a drop from 8.0 to 3.1;
  • the best improvement for remake rating was for Reefer Madness, originally a 1936 propaganda on the dangers of Marijuana (3.6), but the tongue-in-cheek 2005 musical remake with Kristin Bell got a 6.7;
  • Ocean's Eleven was originally a 1960 movie with Frank Sinatra, but the exceptional casting for the version we all know with Damon, Clooney and Pitt led to a nice rating improvement (from 6.6 to 7.7)

Let's take a quick look at the data, comparing original rating to remake rating, the red line corresponds to y = x, meaning that any dot above the line corresponds to a remake that did better than the original, whereas anything under is when the original did better:


The distribution of the difference between remake and original is also quite telling:


The first obvious observation is that, as expected, remakes tend to do worse than the original movie. Only 14% do better (compared to 20% for sequels) and the average rating difference is -1.1 (compared to -0.9 for sequels).

The other observation is that the correlation is not as good as we had seen for sequels. This could make sense as in sequels many parameters are the same as for the original movie (actors, directors, writers). One reason parameters are much more similar for sequels than remakes is the timing between original and remake/sequel: 77% of sequels come less than 5 years after the original installment, whereas 50% of remakes come within 25 years! Parameters are more similar and your fan base has remained mostly intact.

From a more statistical point a view, a paired t-test allowed us to determine that the rating decrease of -1.1 was statistically significant at the 95% level (+/- 0.1).

In terms of modeling, a simple linear model gave us some insight for prediction purposes. In case you want to make some predictions to impress your friends, your best guess to estimate a remake's rating is to multiply the original movie's rating by 0.84.

The original Carrie movie from 1974 had a rating of 7.4, whereas the remake that just came out has a current rating of 6.5 (forecast would be 0.84 * 7.4 = 6.2). Given that movie ratings tend to drop a little after first few weeks of release, that's a pretty good forecast we had there! The stat purists will argue that this results is somewhat biased as Carrie was included in the original dataset...


Taking a step back, why does Hollywood continue making these movies despite anticipating a lower quality movie?

The answer is the same as for sequels: the risks are significantly reduced with remakes, you are almost guaranteed to bring back some fanatics of the original.

And less writers are required as the script is already there! However, it appears that sequels are a safer bet: the fan base is more guaranteed. As we previously saw, release dates are much closer for sequels and movies share many more characteristics.

Thursday, August 21, 2014

Originals and Remakes: Who's copying who?

In the previous post ("Are remakes in the producers' interests?"), I compared the IMDB rating of remake movies to that of the original movie. We found that in the very large majority of cases the rating was significantly lower.

One aspect I did not look at was who-copied-whom from a country perspective. Do certain countries export their originals really well to other countries? Do certain countries have little imagination and import remake ideas from oversees movies?


Using the exact same database as for the previous post (approx. 600 pairs of original-remake movies), I created a database which detailed for each country the following metrics:
  • number of original movies it created
  • number of remake movies it created
  • number of original movies it exported (country is listed for the original, not for the remake)
  • number of remake movies it imported (country is not listed for the original, but for the remake)


Top originals
Nothing very surprising with the US claiming the first place for original movies created, with 325 movies for which remakes were made. The next positions are more interesting, with France and India tied for second place with 36, closely followed by Japan with 30.

Top remakes
Again, nothing very surprising with the US claiming the first place again for number of remakes made, with 370. India is again in second position with 38, followed by UK (14) and Japan (10). Surprising to see France (6) in a distant position for this category given it's second place in the previous category.


Top exporters
Who manages to have their originals get picked up abroad the most? The US is in first position again with (49) with France in relatively very close second place with 32. Japan (21) and UK (14) are in third and fourth positions.


Top importers
Who are the biggest copiers? US is way ahead of everyone with 94, with multiple countries tied at 2 (France, UK, Japan...). Recall that UK, Japan and France were all among the top remake countries, the fact that they are low on the import list indicates that these countries tend to do their own in-house remakes instead of looking abroad for inspiration.


It is difficult to look at other metrics , especially in terms of ratios as many countries have 0 for either category. We could filter to only include countries that have at least 10 movies produced, or at least 5 imported and 5 exported, but even so we would be keeping only a handful movies.


France -> US Movie Relationship
France seemed to be an interesting example here given the high number of original movies produced, the fact that many of those were remade abroad and France's tendency of importing very little ideas. I therefore looked at the French-US relationship in matters of movies.
Wikipedia lists 24 original movies made in France for which a US remake was. In 22 cases the remake had a worst rating, and in the other two cases there was some improvement. 2 out of 24 is about 8.3%, somewhat worse than the overall effect for all original-remake pairs where we had seen improvement in 14% of the cases. Similarly, the average decline of 1.35 for IMDB rating is also somewhat worse than the average across all pairs which we had found to be around 1.1.
The worst remake is without a doubt Les Diaboliques, the French classic was Simone Signoret having a rating of 8.2 while the Sharon Stone remake had 5.1. And who would have thought that Arnold Schwarzennegger would have his name associated with the best remake improvement: his 1994 True Lies (7.2) was much better than the original 1991 La Totale! (6.1).


What about the reverse US -> France effect?
Well it turns out that France only made two remakes of US movies which leaves us with little observations for strong extrapolations. However, the huge surprise is that in both cases the French remake had a better IMDB rating than the original american version. 1978 Fingers had 6.9 while the 2005 The Beat that my Heart skipped is currently rated at 7.3. As for Irma la Douce, it jumped from 7.3 to 8.0.
It's hard, if not impossible, to determine if France is better at directing or whether they are better at pre-selecting the right scripts. What makes it even more head-scratching is the fact that out of the 6 remakes France did, the two US originals are the only ones where the remake did better. The other four were already French originals, and in all four cases the remake was worse.


This France-USA re-adaptation dynamics sheds some light as to why the French were extremely disappointed to hear about Danny Boon signing off rights to his record-breaking Bienvenue chez les Chti's to Will Smith for a Welcome to the Sticks remake. But as always, IMDB ratings are not the driving force at work here, and if Bienvenue chez les Chti's broke attendance and revenue records in France, it could prove to be a cash cow in the US without challenging being a big threat at the Oscars.


Should more cross-country adaptation be encouraged?
The France example should make us pause. 6 remakes. 4 original French movies, all rated worse when remade. 2 original US movies, all rated better when remade.
Is this a general trend?
I split the data in two, one subset where the country for the original and remake are the same (~80% of the data), and another subset where they are not (~20% of the data).
Here are the distributions for the rating difference between remake and original:


The two distributions are very similar, but it still seems that the rating drop is not as bad when the country of origin is the one making the remake than when another country takes the remake into its own hands.
Given the proximities in distributions, a quick two-sample t-test was performed on the means and the difference turns out to be borderline significant with a p-value of 0.0542.
Arguments could go both ways as to whether the remake would have higher rating if done by the same country or another one: movies can be very tied to the national culture and only that country would be able to translate the hidden cultural elements into the remake to make it successful. But one could argue that the same country would be tempted to do something too similar which would not appeal to the public. A foreign director might be inspired and want to bring a new twist to the storyline bring a different culture into the picture.

Looking back at France that does much better adapting foreign movies unlike the rest of the world, we have here witnessed another beautiful case of the French exception!

Friday, February 14, 2014

Easy tips for Hollywood Producers 101: Cast Leonardo DiCaprio! (but cast him quick!)

My wife and I were thinking of going out to see "The Wolf of Wall Street" the other day. Why did this movie catch our eye more than the other twelve or such showing at our local movie theatre?


Had we heard great reviews about it? Nope. Had word-of-mouth finally reached us? Nope. Had we fallen prey to a cleverly engineered marketing campaign? Well yes and no.

Not owning a TV at home, so the least you could say is that our TV ad exposure was quite minimal. And as far as I can remember (although one could argue that this is exactly the purpose of sophisticated inception-style marketing) we din't see that many out-of-home ads nor hear any radio ones. Marketing was involved, but the genius of the marketers behind "The Wolf of Wall Street" was restricted to creating the poster, and not because of the monkey in a business suit nor the naked women, but simply by putting Leonardo DiCaprio right there. My wife and I's reasoning was simply that any movie with Leonardo had to be good.

Now don't go and write us off as Titanic groupies/junkies. I won't deny we both enjoyed that movie, but we don't have posters of him plastered all over our house. But here's the question we found ourselves asking: Can you name a bad movie with Leonardo in it? And harder yet: a bad recent movie with him in it?

Made you pause for a second there didn't it? Few people will argue against the fact that Leonardo is a very good actor and that his movies are generally pretty darn good. But are we being totally objective here? How does Leonardo's filmography compare to that of other big stars? The Marlon Brandos, Al Pacinos, De Niros, Brad Pitts...?

In order to compare actors' filmographies, I turned to my favorite database from IMDB. IMDB has a rather peculiar way of listing actors, directors, producers in its database, and I was unable to find a logic between the individual and the index in the database. But I did notice that all the big actors I wanted to compare Leonardo to had a low index (never above 400), so decided to pull data for all indices less than 1000. Now in the process I got some directors or actors with very few movies, so excluded from the analysis anybody have acted in less than 10 movies. The advantage of pulling this way was the fact that it provided a very wide range of diversity in gender, geography and time. So we have Fred Astaire, Marlene Dietrich, Louis de Funès, Elvis Presley...And to get an even broader picture, I added 30 young rising new stars to the mix. All in all, 826 actors to compare Leonardo to.

Going back to our original question of how good Leonardo is, I've looked at two simple metrics: ratio of movies with an IMDB rating greater than 7, and ratio of movies with an IMDB greater than 8. So how well did Leonardo do? The mean fraction across the actors was 22% for the 7+ rating (median 20%). Leonardo had... 55%! That's 16 out of his 29 movies! Only 15 actors have a higher score. Top of the list? Bette Davis, with 76 of her 91 movies (83.5% having a 7+ rating). The recently deceased Philip Seymour Hoffman also beat Leonardo with 31 out of 52 (59.6%). Fun fact, what male actor of all times has the best ratio here? You have to think out of the box for this one as he's more famous for directing than acting, yet makes an appearance in almost every one of his movies. That's right, Sir Alfred Hitchcock, has 28 of 36 movies (77.8%) rated higher than 7.

Name Number of movies Number of 7+ movies Ratio of 7+ movies
Bette Davis 91 76 83.5%
Alfred Hitchcock 36 28 77.8%
François Truffaut 14 10 71.4%
Emma Watson 14 10 71.4%
Bruce Lee 25 16 64.0%
Terry Gilliam 16 10 62.5%
Andrew Garfield 13 8 61.5%
Alan Rickman 44 27 61.4%
Frank Oz 31 19 61.3%
Daniel Day-Lewis 20 12 60.0%

What about for movies rated higher than 8? Leonardo does even better according to this metric! The average actor has only 2.7% (median 1.7%) of movies with such a high rating. Leonardo has 5 out of 29, 17.2%! And only 8 actors do better with this metric. No more Bette Davis (plummets to 3.2%), but replaced by Grace Kelly (3 out of 11, 27.3%) who tops the chart. Sir Alfred is impressive once again with 9 out of 36 (25%).

Name Number of movies Number of 8+ movies Ratio of 8+ movies
Grace Kelly 11 3 27.3%
Alfred Hitchcock 36 9 25.0%
Anthony Daniels 12 3 25.0%
Chris Hemsworth 12 3 25.0%
Terry Gilliam 16 3 18.8%
Elizabeth Berridge 11 2 18.2%
Elijah Wood 56 10 17.9%
Groucho Marx 23 4 17.4%
Leonardo DiCaprio 29 5 17.2%
Quentin Tarantino 24 4 16.7%

Now the big stars we mentioned earlier do pretty well, just not as good as Leonardo:

Name Number of movies Number of 7+ movies Number of 8+ movies Ratio of 7+ movies Ratio of 8+ movies
Marlon Brando 40 18 4 45.0% 10.0%
Brad Pitt 48 23 6 47.9% 12.5%
Robert De Niro 91 32 8 35.2% 8.8%
Leonardo DiCaprio 29 16 5 55.2% 17.2%
Clint Eastwood 59 19 6 32.2% 10.2%
Morgan Freeman 69 24 7 34.8% 10.1%
Robert Downey Jr. 68 17 1 25.0% 1.5%

Another thing worth repeating to put these numbers in perspective: we are not comparing Leonardo to your "average" Hollywood actor. Because of the way IMDB has matched actors with indices, we are comparing Leonardo to some of the greatest of all times here!

Remember how earlier one we mentioned that it was even harder to find a recent bad movie by Leonardo? Let's look at his movie ratings over time to confirm this impression:


Wow. With the exception of J.Edgar in 2011, every single one of his movies since 2002 (that's over this last decade !) has had a rating greater than 7! 12 movies!

Now one might argue that there is a virtuous circle here: the more you become a star, the easier it is to get scripts and parts for great movies and do the easier it becomes to continue being a super star. For each actor in my dataset, I ran a quick linear regression to see improvement of movie rating over time. Leonardo stands out here quite a bit too, for he is among the rare actors to have positive improvement. The "average" actor's movie lose 0.01 IMDB rating points per year, Leonardo gains 0.1 per year, putting him in the top 15 of the data set:

Name Number of movies Number of 8+ movies Number of 7+ movies Improvement
Taylor Kitsch 11 1 2 0.26
Rooney Mara 11 1 4 0.26
Justin Timberlake 18 0 3 0.23
Chloe Moretz 24 1 6 0.19
Bradley Cooper 26 0 7 0.18
Juliet Anderson 50 1 12 0.17
Mila Kunis 23 1 3 0.16
Chris Hemsworth 12 3 7 0.15
Tom Hardy 27 3 12 0.14
Andrew Garfield 13 0 8 0.12
Mia Wasikowska 21 0 9 0.12
Barbara Bain 14 1 2 0.11
George Clooney 38 1 15 0.11
Jason Bateman 32 2 9 0.11
Leonardo DiCaprio 29 5 16 0.10

What's quite surprising in the last table is that those topping the list in terms of year over year improvement are not the old well-established actors having great choice in scripts, but the new hot generation in Hollywood!

What happens to the megastars? Well let us look at the rating evolution of some of these stars:

Fred Astaire:

Marlon Brando:

Bette Davis:

It appears that they all go through some glory days. Remember Leonardo with his 12 years of 12 movies greater than 7 aside from J. Edgar? Well Bette Davis had 46 such movies, without any exceptions, over a span of 29 years! But not a great way to end a career... Same goes for Fred Astaire and Marlon Brando, started off doing well but end of careers are tough even for big stars, or might I say especially for big stars. Naturally, the hidden question is whether ratings of later movies go down because actors aren't as good as they were, or because good roles don't come as much, because they only get casted for grumpy grandparents in bad comedies. Correlation vs causation...

So back to Leonardo. He's still young, so the primary impulse my wife and I had of "Leonardo's in it so it's got to be good" was not completely irrational, but it might be in 5/10 years from now. Same goes for all the rising top stars. Cast them while they're hot, cause nothing is eternal in Hollywood.


Wednesday, July 3, 2013

Hollywood's lack of originality: "Let's make a sequel!" (Part 3, yes I realize the irony)

As indicated by the title, this is part 2 of the analysis of movie sequels.
In the first post I described the IMDB data used for the analysis and shared some preliminary statistics on the distribution of number of movie installments in movie series.
In part 2 I focused on comparing IMDB ratings for the original movie and its sequel.

This post looks at series with 3 or more installments.


The sequel has a sequel!!!

Looking at multiple installments is a little tricky. Can I compare the average IMDB rating change between installments 1 and 2 with the change between installments 2 and 3? Probably, but only if I look at the same sample. Let me explain myself. To compute the change between installments 1 and 2 I might have 1000 series to look at (2000 movies then). But when looking at the change between 2 and 3, my sample will be smaller (I will no longer have all the series that only had two installments). Is that so much of an issue? It could be if there is what is called a "lurking third variable". Perhaps moviemakers only make a third installment when the second installment wasn't too bad, so series with only two installments could be biased in the sense that they are the ones where the second installment did really terrible and so no third installment was made. So if we really want to compare the drop-off between 1 and 2 with the drop-off (I am assuming it is another drop-off!) between 2 and 3, we should restrict the analysis to only series with at least three installments.

So there are a couple of things we might want to look at:
1) average change between installments 1 and 2 for all movies that have 2 and only 2 installments
2) average change between installments 1 and 2 for all movies that have 3+ installments
3) average change between installments 2 and 3 for all movies that have 3+ installments

Comparing 1) and 2) will give us an idea whether third installments are favored for series where second installments didn't do too badly. Comparing 2) and 3) will allow us to compare the 1 -> 2 and 2 -> 3 effects.

Here are the results:


Series length Sample Size From Installment ... To installment ... IMDB Rating Difference
All series 606 1 2 -0.87
Exactly 2 410 1 2 -0.92
3 or more 196 1 2 -0.78
3 or more 196 2 3 -0.33

So it does seem that series with exactly 2 installments had a larger 1 to 2 installment drop-off (-0.92) than those with 3 or more installments (-0.78), however another (unpaired) t-test revealed that the difference was not significant. Budget and revenue are probably more important factors than IMDB ratings taken into account at Hollywood before deciding whether to make a third movie, but I suspect there is still some correlation between rating and revenue (no worries a future post will address this!).

Another interesting finding is that the drop-off from 2 to 3 is much smaller than from 1 to 2. This can make sense: 
1) First of all, an IMDB rating can only go so low, you can't keep losing a full point rating everytime.
2) It is safe to assume the original movie was seen by a rather diverse crowd, whereas the second might have been seen only by the first movie's fan base, and very likely that those were about the same as those who saw the third. In other words, a much bigger overlap is to be expected between those who saw the second and third as opposed to first and second, which translates into more similar ratings.


More than 3?

For more than three installments, the sample starts to shrink quite rapidly, which is why I went for a more visual approach. I normalized all first installments to a score of 100 in order to track the evolution of all subsequent installments. This graph will allow us to shed some light on some hypotheses from the previous section: ratings go down but at a slower pace and tend might eventually converge with the same hard-core fan base rating the movies.


A slightly more confusing plot where trends are harder to establish but which nonetheless conveys both the initial rating drop-off as well as the sharp decrease in series length is the spaghetti-plot, where each line represents the evolution of a given series rating installment after installment.


From the previous two graphs, it appears that the decrease we observed over the first few installments continues until the fourth installment which is typically a series all-time low, with installments 5 and 6 usually bouncing surprisingly back. However, as shown in the spaghetti plot, the sample size is severely reduced and it would be dangerous to draw any strong conclusions.

It also seemed that quite a few series ended on surprisingly good ratings, sometimes the best or second best after the first installment:
  • The Rocky series was strictly decreasing from the start: 8.0, 6.9, 6.3, 6.2, 4.7 but finished with 7.2
  • The Rambo series had a similar pattern: 7.5, 6.0, 5.2, and...  7.1!
  • The Harry Potter series has ratings grouped between 7.2 and 7.6 for the first 7 installments but the eight and final finished at 8.1
Could it be that for these series a real effort was made to finish on a strong note? Stallone probably put more thought into the script waiting 16 years for the last Rocky whereas the first 5 came within an average of 3 to 4 years apart from each other. Same for Rambo within a 20 year lapse compared to the three year gaps for the first movies.

Also, in the cases mentioned above, the last installment was usually declared as such, in which case also ratings might be higher from fans saddened to witness the final installment.


Closing thought

What have we learned? The primary conclusion is that the common belief that sequels do worse than the original is definitely valid. Although not proven here, the most likely explanation is that Hollywood doesn't care about making terrible movies as long as they generate a profit but more importantly (since good movies are more likely to generate greater profits than terrible movies, a priori) they want as little risk as possible involved. A guaranteed million dollar profit is better than a 50/50 chance of generating either three million or losing a million.

Thursday, June 20, 2013

Hollywood's lack of originality: "Let's make a sequel!" (Part 2, yes I realize the irony)

As indicated by the title, this is part 2 of the analysis of movie sequels. In the previous post I described the IMDB data used for the analysis and shared some preliminary statistics on the distribution of number of movie installments in movie series.

In this post I will focus on comparing IMDB ratings for the original movie and its sequel.

The next post will look at series with 3 or more installments.


Number 2

I will first focus on the second installment. Analysis of installments 3+ will be dealt with further down.

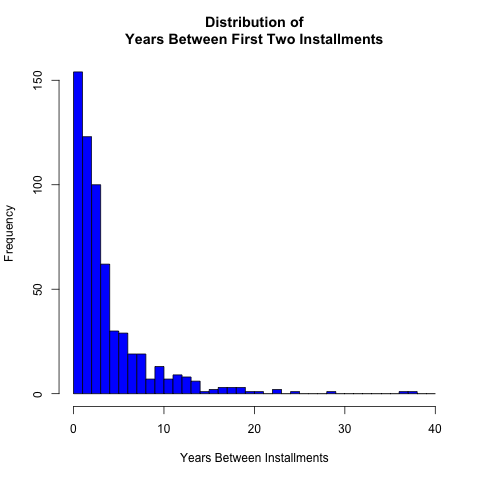
First of all, how much time goes by before the second installment comes out?

Here's a quick look at the distribution:


Yes, 37 years separate the two installments of The Wicker Man series. It's actually a trilogy in the works with the third installment due in 2014. The first one came out in 1973, and the second in 2010!

A couple of outsiders aside, the vast majority of sequels come soon after the original movie: in 77% of cases less than 5 years separate the two, in 92% of cases 10 years separate the two.

Now for the meat of the analysis: how does the second movie's rating relate to the first one's? As done in previous posts, I will focus on the IMDB rating. Even if there are potentially many biases with this metric (die-hard fans, foreign movies not rated as well as US movies...), I was hoping that by looking at differences in ratings between sequels most of these biases would cancel each other out.

The following graph plots the second installment's IMDB rating against the first installment's IMDB rating. Dots above the diagonal indicate sequels that did better, dots under indicate those that did worse.

As expected, sequels more likely exist for profit reasons than for creating all-time classics.

A few fun facts you can re-use at your next dinner party:
  • Only 19.7% of second installments did just as well (4.6%) or better (15.1%) than the first.
  • Some of the worst decreases in ratings go to The Mask (Jim Carrey's original 6.7 movie plummets to 2.1 with Son of the Mask which he wisely stayed away from) and The Exorcist (the original grandiose 1973 classic went from 8.1 to 3.6 in just four years).
  • One of the best increases in ratings goes to Captain America (the last installment that came out in 2011 with a rating of 6.8 is actually considered the sequel to the original 1990 movie that has a rating of 2.9).
  • On average, sequels have an IMDB score 0.9 less than the first movie.
Simple linear models can be run using the data; the main question we can ask ourselves is whether to include an intercept:
Sequel rating = alpha * Original rating (+ intercept)

Actually, a quick graph reveals that the intercept has little impact on the fit itself:


These models suggest that a better relationship than the average 0.9 decrease between the first two installments is that the sequel's rating is either 0.9 + 0.72 * Original Rating or simply 0.85 * Original Rating based on which model you prefer. In both cases we still conclude that the sequel usually does worse.

But does it do significantly worse? Significance of the decrease can be assessed with a paired t-test. Quick stat reminder, you absolutely want a paired t-test here. If you were to do a naive t-test between two independent populations you would reach the counter-intuitive conclusion that sequels do just as well because the between movie spread of movie ratings is much greater than the within movie spread. In other words, suppose all movies have a uniform rating between 1 and 10, and all sequels systematically have a rating 0.3 less making the sequel range go from 0.7 to 9.7. A t-test would be unable to pick up the systematic downward shift (except with huge sample size). A paired test in necessary because the two measurements are dependent (not simply because we want to measure significance!).

In our case, the paired t-test returns that the observed decrease in IMDB ratings is significant and actually very highly so.


In the next post we will look at series with three or more installments and view how ratings evolve for these longer series.