Showing posts with label chicago bulls. Show all posts

Tuesday, December 17, 2019

Can the 2019-2020 Lakers get 70 wins?


I know I know, it's way too early to have this conversation.
If we're already having it with less than a third of the season under our belts, can you imagine what it will be like for the rest of the way? "70" might be a top Google search in 2020!

That being said, the conversation has already started, here's the record for the '71 Lakers, blablabla, very similar, blablabla... So it's difficult to block it out entirely and as a big fan of visualization, even more difficult not to add a couple of visuals to avoid all the number comparisons we're seeing.

Very quick background: the NBA regular season consists of 82 games. 70 was a mythical number of wins no team seemed able to reach, the Lakers getting the closest with 69 in 1972. That all changed in 1996 when Michael Jordan's Bulls went on to win 72. Twenty years later, the Golden State Warriors were able to inch just a bit further with 73 wins which is the record as of today. (People will routinely point out that while the Bulls won the championship that year, the Warriors lost the Finals in 7 games...). The year after they got 72 wins, the Bulls were close to repeating the 70-win feat but lost their last two games and ended at 69. They did however win the championship again that year.

This year, the Los Angeles Lakers are off to a really hot start, and after the Bucks' loss yesterday, lead the NBA with a 24-3 record. This hot start has naturally fueled the 70-win conversation, so how do all these teams stack up at this point of the regular season?

Here's a game-by-game evolution of those four teams' win percentages:


The gray horizontal line is 83.4% representing the 70 win threshold. What really stands out here is the overall downward trend as the season progresses. It took a while for the '71 to get above the 70-win threshold , but once above it seems a very difficult level to maintain. No team was just under the limit to finally make it above in the final stretch of the season.

While the Lakers are currently tied with the '95 Bulls, '96 Bulls and '71 Lakers, they will need to keep accumulating wins at a higher than 83.4% win rate to provide an acceptable cushion for the downward end of year trend.

As for the rationale behind that downward trend, it could be due to fatigue, although one could argue that all teams should be similarly affected, but more likely it is due to final Playoff standings starting to fit in. The 7th, 8th, 9th and 10th seed are all fighting for the last two Playoff spots and will do whatever it takes to win.

It could very well be that LeBron and company will have to make some late season decisions as to whether they want to pursue the 70-win mark or maximize their chances for title. Officially they'll declare the latter as being their priority, but we all know that if LeBron can add a 70-win season to his resume he wouldn't spit on that. He also knows first-hand the risk associated with chasing the wrong priority, as his team was the one who beat the 73-win Warriors....

Friday, May 15, 2015

Consequence of Morey's Law: Lucky vs Unlucky teams

In a previous post, I looked at a 1994 paper by Daryl Morey (current Houston Rockets GM) who investigated how a team's winning percentage was related to the number of points they scored and allowed, deriving the "modified Pythagorean theorem":

expected win percentage =
  pts_scored ^ 13.91 / (pts_scored ^ 13.91 + pts_allowed ^ 13.91)

At the end of his paper, Daryl explores teams who had the biggest delta between their actual and predicted wins. In 1993-1994, the Chicago Bulls and Houston Rockets top the list and Daryl refers to them as lucky teams. But why is lucked involved?


The rationale is that if you have two teams A and B with almost identical points scored and points allowed, we would expect them to have very similar win percentages. The only way to create a discrepancy (without changing points scored and points allowed... too much), is by changing the outcome of the very close games. So for all the games team A won by a point, flip the scores so that they lose by 1, and reversely for team B who now wins all the games they previously lost by 1. With this hypothetical construction, we will have two teams still with very similar points scored and allowed but potentially different records. It would make common sense that for very close games the probability of each team winning is around 50%, so winning or losing amounts to "luck", whether a desperation buzzer-beater is made or bounces off the back of the rim. And so it would make sense that teams with high discrepancies between actual and predicted wins were either much better or much worse than 50% in close games. Let's confirm.

Here's the table of teams with discrepancies greater or equal to 6 between their actual and projected records, ranked by year:

Team Year Scored Allowed Wins (proj) Wins (actual) Win %
NJN 2000 98.0 99.0 38 31 37.8
DEN 2001 96.6 99.0 34 40 48.8
NJN 2003 95.4 90.1 56 49 59.8
CHA 2005 94.3 100.2 24 18 22.0
NJN 2005 91.4 92.9 36 42 51.2
IND 2006 93.9 92.0 47 41 50.0
TOR 2006 101.1 104.0 33 27 32.9
UTA 2006 92.4 95.0 33 41 50.0
BOS 2007 95.8 99.2 31 24 29.3
CHI 2007 98.8 93.8 55 49 59.8
DAL 2007 100.0 92.8 61 67 81.7
MIA 2007 94.6 95.5 38 44 53.7
SAS 2007 98.5 90.1 64 58 70.7
NJN 2008 95.8 100.9 27 34 41.5
TOR 2008 100.2 97.3 49 41 50.0
DAL 2010 102.0 99.3 49 55 67.1
GSW 2010 108.8 112.4 32 26 31.7
MIN 2011 101.1 107.7 24 17 20.7
PHI 2012 93.6 89.4 43 35 53.0
BRK 2014 98.5 99.5 38 44 53.7
MIN 2014 106.9 104.3 48 40 48.8


So how did these teams fare in close games? I've labelled a team/year as High if they won 6 or more games than expected (8 teams from the previous list), Low if they lost 6 or more  games than expected (13 teams from the previous list), and Normal otherwise. I then look for each group their win percentage in closely contested games (final scores within 1, 2 and 3 points).

Final scores within 1 point:

Type # Wins # Games Win %
Normal 721 1439 50.1
Low 8 21 38.1
High 2 2 100.0

Final scores within 2 points:

Type # Wins # Games Win %
Normal 1760 3515 50.1
Low 20 52 38.5
High 10 13 76.9

Final scores within 3 points:

Type # Wins # Games Win %
Normal 2820 5617 50.2
Low 24 80 30.0
High 14 19 73.7

Our intuition was correct and so were Daryl's closing comments: teams can indeed be qualified as lucky and unlucky, some winning almost 3 out of 4 close match-ups, others losing 2 out of 3 tight games. This intangible "luck" factor is sufficient to explain why certain teams have much better or worse records than their offense/defense would typically lead to. It doesn't take much for to flip the outcome of an entire game.


As a quick aside, much has been said about the San Antonio Spurs this year and their drop from a potential 2nd seed to 6th seed entering the Playoffs. Most articles focused on their loss on the final day of the regular season which led to that seeding free-fall, but was excessive focus placed on that last game? Had they been particularly lucky/unlucky during the season? It turns out their record is a couple games lower than what the modified Pythagorean theorem would have predicted, and that they weren't particularly lucky or unlucky in their close games, winning 2 of 5 games decided by 1 point, and 6 of 13 decided by 3 points or less.

Friday, April 19, 2013

Who's searching for Michael Jordan?


In a previous post we analyzed the trend and seasonality in Google searches for Kobe Bryant. We then looked at the evolution of queries for Lebron James, Derrick Rose, Steve Nash. But what about the greatest NBA legend?

Here's the raw data from Google Trends for Michael Jordan, strating in 2004 despite his last game being in 2003:


Using the same decomposition analysis detailed in the Kobe Bryant post, we get the following results:


For a retired NBA player, Michael isn't doing too badly!

From the seasonality it would seem that he continues to have the offseason / regular season / Playoff pattern, but a closer look reveals the spikes are in February! The only explanation I have is that it is his birthday and being Michael Jordan people tend to hear about it and follow-up on a search, perhaps to refresh his memory at how good a player he was.


Since 2009, searches for him have actually steadily increased, which basically correspond to the big spike when he was inducted in the Hall of Fame (August 2009). The second huge recent spike is the renewed interest in him when he celebrated his 50th birthday. It was also rumored that he was still in such good shape that he could return to play a few games in the NBA! The big dip after the spike is probably due to people that would have normally searched for him in March had searched for him already the previous month!

Wednesday, April 17, 2013

Who's searching for Derrick Rose?


In a previous post we analyzed the trend and seasonality in Google searches for Kobe Bryant. We then looked at the evolution of Lebron James' queries. But what about another famously injured player whose return is eagerly awaited?

Here's the raw data from Google Trends for Derrick Rose, the 2011 MVP:


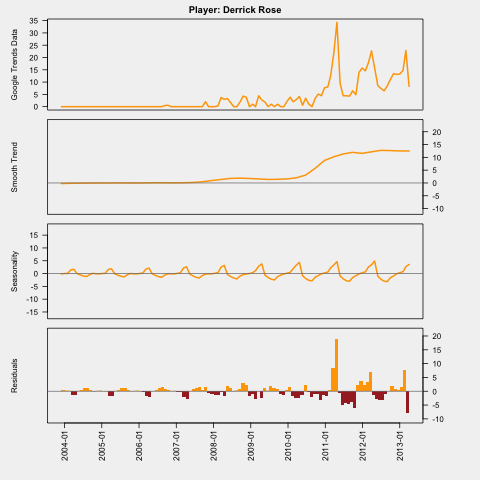
Using the same decomposition analysis detailed in the Kobe Bryant post, we get the following results:


What can be said from the decomposition?

Although he started playing or the Chicago Bulls in 2008, his popularity only increased (rather significantly) during the 2010 offseason. Since then his popularity has maintained high levels.

The seasonality is harder to rely on given the small number of seasons he has played, but we do again see the offseason/regular season/Playoffs effect, but unlike Kobe and Lebron that usually reach the later stages of the Playoffs, Derrick's peaks are in April/May for the beginning of the Playoffs only. Could Google search peaks be a criteria for distinguishing the future stars from the current stars?

As far as outliers are concerned, the main one is at the end of the regular season in 2011, and guess who won the MVP at that time? Despite his popularity, he was still not in the same league as the Kobes and Lebrons, so this MVP title did have many people searching to learn more about him.

One surprising element is the absence of a big residual peak the following year when he injured himself at the beginning of the Playoffs. I guess a lot of the additional queries were picked up by the Playoff seasonality thus explaining the absence of a bigger outlier in April 2012. We are seeing a big dip in queries right now simply because this is the beginning of the Playoffs and he has yet to return to the Bulls' lineup...