Showing posts with label daryl morey. Show all posts

Friday, May 15, 2015

Consequence of Morey's Law: Lucky vs Unlucky teams

In a previous post, I looked at a 1994 paper by Daryl Morey (current Houston Rockets GM) who investigated how a team's winning percentage was related to the number of points they scored and allowed, deriving the "modified Pythagorean theorem":

expected win percentage =
  pts_scored ^ 13.91 / (pts_scored ^ 13.91 + pts_allowed ^ 13.91)

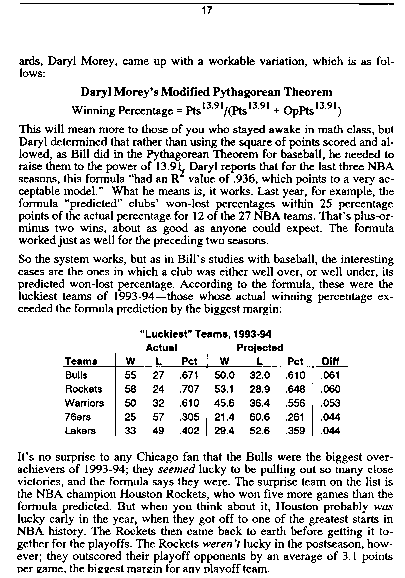
At the end of his paper, Daryl explores teams who had the biggest delta between their actual and predicted wins. In 1993-1994, the Chicago Bulls and Houston Rockets top the list and Daryl refers to them as lucky teams. But why is lucked involved?


The rationale is that if you have two teams A and B with almost identical points scored and points allowed, we would expect them to have very similar win percentages. The only way to create a discrepancy (without changing points scored and points allowed... too much), is by changing the outcome of the very close games. So for all the games team A won by a point, flip the scores so that they lose by 1, and reversely for team B who now wins all the games they previously lost by 1. With this hypothetical construction, we will have two teams still with very similar points scored and allowed but potentially different records. It would make common sense that for very close games the probability of each team winning is around 50%, so winning or losing amounts to "luck", whether a desperation buzzer-beater is made or bounces off the back of the rim. And so it would make sense that teams with high discrepancies between actual and predicted wins were either much better or much worse than 50% in close games. Let's confirm.

Here's the table of teams with discrepancies greater or equal to 6 between their actual and projected records, ranked by year:

Team Year Scored Allowed Wins (proj) Wins (actual) Win %
NJN 2000 98.0 99.0 38 31 37.8
DEN 2001 96.6 99.0 34 40 48.8
NJN 2003 95.4 90.1 56 49 59.8
CHA 2005 94.3 100.2 24 18 22.0
NJN 2005 91.4 92.9 36 42 51.2
IND 2006 93.9 92.0 47 41 50.0
TOR 2006 101.1 104.0 33 27 32.9
UTA 2006 92.4 95.0 33 41 50.0
BOS 2007 95.8 99.2 31 24 29.3
CHI 2007 98.8 93.8 55 49 59.8
DAL 2007 100.0 92.8 61 67 81.7
MIA 2007 94.6 95.5 38 44 53.7
SAS 2007 98.5 90.1 64 58 70.7
NJN 2008 95.8 100.9 27 34 41.5
TOR 2008 100.2 97.3 49 41 50.0
DAL 2010 102.0 99.3 49 55 67.1
GSW 2010 108.8 112.4 32 26 31.7
MIN 2011 101.1 107.7 24 17 20.7
PHI 2012 93.6 89.4 43 35 53.0
BRK 2014 98.5 99.5 38 44 53.7
MIN 2014 106.9 104.3 48 40 48.8


So how did these teams fare in close games? I've labelled a team/year as High if they won 6 or more games than expected (8 teams from the previous list), Low if they lost 6 or more  games than expected (13 teams from the previous list), and Normal otherwise. I then look for each group their win percentage in closely contested games (final scores within 1, 2 and 3 points).

Final scores within 1 point:

Type # Wins # Games Win %
Normal 721 1439 50.1
Low 8 21 38.1
High 2 2 100.0

Final scores within 2 points:

Type # Wins # Games Win %
Normal 1760 3515 50.1
Low 20 52 38.5
High 10 13 76.9

Final scores within 3 points:

Type # Wins # Games Win %
Normal 2820 5617 50.2
Low 24 80 30.0
High 14 19 73.7

Our intuition was correct and so were Daryl's closing comments: teams can indeed be qualified as lucky and unlucky, some winning almost 3 out of 4 close match-ups, others losing 2 out of 3 tight games. This intangible "luck" factor is sufficient to explain why certain teams have much better or worse records than their offense/defense would typically lead to. It doesn't take much for to flip the outcome of an entire game.


As a quick aside, much has been said about the San Antonio Spurs this year and their drop from a potential 2nd seed to 6th seed entering the Playoffs. Most articles focused on their loss on the final day of the regular season which led to that seeding free-fall, but was excessive focus placed on that last game? Had they been particularly lucky/unlucky during the season? It turns out their record is a couple games lower than what the modified Pythagorean theorem would have predicted, and that they weren't particularly lucky or unlucky in their close games, winning 2 of 5 games decided by 1 point, and 6 of 13 decided by 3 points or less.

Saturday, February 28, 2015

Morey's Law: How do points scored and points allowed tie to win percentage?


It all started in baseball, when Bill James found a very elegant formula linking a baseball team's winning percentage to the number of runs it scored and allowed:

expected win percentage =
  runs_scored ^ 2 / (runs_scored ^ 2 + runs_allowed ^ 2)

Because the variables are raised to the second power, the formula became knows as the "Pythagorean expectation formula".

In 1994, Daryl Morey, one of the biggest proponent of analytics in basketball and now GM for the Houston Rockets, adapted the formula for basketball teams. The overall structure remains the same, but the power of 2 was replaced by 13.91. Here's an extract from Daryl's formula in STATS Basketball Scoreboard:


Essentially the same formula as for baseball but with 13.91 as the power:

expected win percentage =
  pts_scored ^ 13.91 / (pts_scored ^ 13.91 + pts_allowed ^ 13.91)

In this post, I wanted to further explore this formula and answer questions such as: how accurate is it? it was based on data up until 1993-1994, is it still accurate with today's data? are there other more accurate formulas out there?

To start off, I extracted all relevant statistics by team and by year for the past 15 complete seasons, going from 1999-2000 to 2013-2014.

Let's start by looking at how accurate Daryl's formula is when looking through these last seasons:


Well, formula still applies quite well to say the least! Of course, the exact coefficient might be slightly off so I used the more recent data, and fit the same model. The fitted value for the exponent turned out to be 13.86. Despite all the rule changes over the bast twenty plus years (three free throws on three-point fouls, hand-checking, clear path...) and the fact that the early nineties are regarded as a completely different era of basketball as now (somewhat linked to the rule changes), the value is almost identical, less than a 0.4% difference!

But back to the formula. It seems to perform remarkably well and fitting the data, but can we do better? There is room for additional flexibility: in Morey's formula, all three terms are raised to the same power. What if points scored and points allowed were allowed to be raised to different values?

expected win percentage =
  pts_scored ^ a / (pts_scored ^ a + pts_allowed ^ b)

Or if all three terms could have different powers?

expected win percentage =
  pts_scored ^ a / (pts_scored ^ c + pts_allowed ^ b)

When fitting those new more flexible models, it turns out that the fitted coefficients remain very close to 14. Naturally with additional we observe a decrease in residual sum of squares, but nothing extravagant either. We'll revisit this point later in the post.

But let's step back for a minute, what exactly does the exponent value correspond to? For values scored and allowed points ranging from 90 to 110, I generated three charts displaying expected win percentage for the respective exponent values of 2, 14 and 50.


We notice that the value controls how slowly/quickly the surface goes to 0 and 1 as the difference between points scored and allowed increases. When points scored is 100 and points allowed is 95, win percentages are 52% (exp of 2), 67% (exp of 14) and 93% (exp of 50).

But something else stands out in all graphs: they appear invariant in one direction, the first diagonal (going through points (90, 90) and (110, 110)). In other terms, a team allowing 90 points and scoring 93 has an expected winning percentage only very slightly off from another team scoring 110 and allowing 107. What truly matters is the delta between points allowed and scored, not the absolute value of these two numbers.

Let's do some very simple exploratory data analysis looking at actual win percentages against points scored and allowed:


As one would have expected there is definitely some correlation there - especially regarding points allowed (which could be an additional argument for promoting a strong defense over a strong offense, but that is for another time).


But things get really interesting when we look at the difference between points scored and allowed:


You don't often come across a correlation of 0.97 just plotting two randoms against each other in your data set! It looks like someone created a rectangular stencil in cardboard, placed it over tan empty plot, and asked their 3-year old kid to go polk-a-dot-crazy within the rectangular region. Can this strong relationship be leveraged for an alternative formula to Morey's?

A simple linear model begs to be fit, but would it also make sense to add a quadratic or cubic term? Quadratic (or any even number fo that matter) does not seem reasonable: a delta of 5 or -5 suggest VERY different types of performances, so only odd-numbered powers should be considered. Here's the plot with the fits from a single term and with an additional cubic term:


We've now come to the point where we have five models (the three "pythagorean" with various degrees of flexibility which I'll refer to as the single/double/triple power models based on how many coefficients are fit) and two linear models (with and without the cubic term). Can one be established as being significantly superior to the others? Will Morey's formula hold?

Of course the easiest way to compare would be looking at the fits and comparing residual sum of squares, but this will always lean towards the more complex models and yield to the overfitting problems we constantly hear about. So how do we go about it? Simply the way overfitting is dealt with in the abundant litterature: cross-validation. The data is randomly split in to training and testing datasets, the model is constructed based on the training data, but evaluated on the test data never seen before.

And the results are in!


Based on my random splits, it seems's that while all models perform very similarly, Morey's formula (simple power) has a slight advantage. It didn't achieve the minimal RSS, did yield the maximum, but median RSS was lower than all other models, though not significantly.

So after all this work, we weren't able to come up with a better way to reliably and robustly compute expected win percentages than a formula over 20 years old!

In a next post we'll dig a little deeper into the data and try to understand the largest discrepancies. In his original paper, what did Daryl Morey mean when referring to the Chicago Bulls as a lucky team in 1993-1994?