Showing posts with label nba standings. Show all posts

Tuesday, November 24, 2015

NBA stock: 2016 is a highly volatile year!

Some things never change.
I haven't followed the new 2015-2016 NBA season as closely as I would have, but it's impossible to ignore that our two finalists from last years are still dominating their conferences, San Antonio keeps chugging along as it has always done since like forever, and similarly to last year the Lakers and 76ers are in for a terrible season if the first 20% of the season is any indication.

That being said, there is a rather lengthy list of surprises, good and bad:
  • The Knicks were plain awful last year but now have a winning record
  • The Rockets and Clippers gave us an intense Western Conference semifinals yesterday both playing at a very high level but both now have losing records
  • The Hawks dominated the Eastern Conference last year yet are now ranked 6th in that same conference
  • The Pelicans made the Playoffs last year but this year are playing just slightly better than the Lakers
  • The Jazz were ranked 11th in the Western Conference last year, and are now ranked second
I could go on, but you get the idea. Now of course, nobody would expect every season to be an exact replicate of the previous one, players get injured, players transfer, coaches come and go... So some volatility in rankings is expected, but the question is how much?

Going back up to the 2005-2006 season, I pulled final regular season rankings for each season and each team (taking relocations into account for the Sonics, Bobcats and Hornets), and looked at absolute change from year to year. For instance, the Toronto Raptors finished 10th of the Eastern Conference in 2012-2013, 3rd in 2013-2014, 4th in 2014-2015. This would therefore be counted as a change of 7, followed by a change of 1 in conference ranking. Rank changes were averaged across all teams for each year. Here's the evolution of average rank change across all teams:
It appears that my hunch was not entirely unfounded: as of today (2015-11-24), current rankings have never been as different from the previous year going back to 2005-2006! (of course the season has only kicked off, and we are not entirely comparing apples to apples). 2014 was a close second, when 6 out of 30 teams had their conference rankings change by 7 or more positions.

What if we were to split out results for each conference?
It appears that the Eastern Conference is typically much more volatile than than its western counterpart. Up until 2014-2015, the Western Conference had never had an average rank change exceeding 3.2, a value that the Eastern Conference exceeded 5 times in the last 9 years! But comparing the first 15 games of the 2015-2016 season to last year's final standings, we have an average rank change of 4, tying the maximum value ever observed in either conference.

To finish off, it would be interesting to put these values in context and evaluate how much carry-over there is from one season to the next. Is an average of 3 or 4 rank changes per team high? or low? Our baseline would be a completely randomized basketball association where players are completely reshuffled from one year to the next and so each year's ranking is entirely random. I ran 100,000 simulations to see what the expected number of rank changes would be.
It turns out that a value of 4 is not particularly extreme: in our purely randomized world, about 15% of seasons would be less volatile rank-wise than what we are witnessing today!

I've spent quite some time running basketball analyses, from the number of expected runs and the incremental value of home court advantage to trying to forecast game outcomes based on team performance, yet it seems my conclusion is always the same: there is so much statistics can uncover, no matter what approach you take there always seems to be a strong unexplained random component which makes every team, every season, every championship so unique!


Friday, May 15, 2015

Consequence of Morey's Law: Lucky vs Unlucky teams

In a previous post, I looked at a 1994 paper by Daryl Morey (current Houston Rockets GM) who investigated how a team's winning percentage was related to the number of points they scored and allowed, deriving the "modified Pythagorean theorem":

expected win percentage =
  pts_scored ^ 13.91 / (pts_scored ^ 13.91 + pts_allowed ^ 13.91)

At the end of his paper, Daryl explores teams who had the biggest delta between their actual and predicted wins. In 1993-1994, the Chicago Bulls and Houston Rockets top the list and Daryl refers to them as lucky teams. But why is lucked involved?


The rationale is that if you have two teams A and B with almost identical points scored and points allowed, we would expect them to have very similar win percentages. The only way to create a discrepancy (without changing points scored and points allowed... too much), is by changing the outcome of the very close games. So for all the games team A won by a point, flip the scores so that they lose by 1, and reversely for team B who now wins all the games they previously lost by 1. With this hypothetical construction, we will have two teams still with very similar points scored and allowed but potentially different records. It would make common sense that for very close games the probability of each team winning is around 50%, so winning or losing amounts to "luck", whether a desperation buzzer-beater is made or bounces off the back of the rim. And so it would make sense that teams with high discrepancies between actual and predicted wins were either much better or much worse than 50% in close games. Let's confirm.

Here's the table of teams with discrepancies greater or equal to 6 between their actual and projected records, ranked by year:

Team Year Scored Allowed Wins (proj) Wins (actual) Win %
NJN 2000 98.0 99.0 38 31 37.8
DEN 2001 96.6 99.0 34 40 48.8
NJN 2003 95.4 90.1 56 49 59.8
CHA 2005 94.3 100.2 24 18 22.0
NJN 2005 91.4 92.9 36 42 51.2
IND 2006 93.9 92.0 47 41 50.0
TOR 2006 101.1 104.0 33 27 32.9
UTA 2006 92.4 95.0 33 41 50.0
BOS 2007 95.8 99.2 31 24 29.3
CHI 2007 98.8 93.8 55 49 59.8
DAL 2007 100.0 92.8 61 67 81.7
MIA 2007 94.6 95.5 38 44 53.7
SAS 2007 98.5 90.1 64 58 70.7
NJN 2008 95.8 100.9 27 34 41.5
TOR 2008 100.2 97.3 49 41 50.0
DAL 2010 102.0 99.3 49 55 67.1
GSW 2010 108.8 112.4 32 26 31.7
MIN 2011 101.1 107.7 24 17 20.7
PHI 2012 93.6 89.4 43 35 53.0
BRK 2014 98.5 99.5 38 44 53.7
MIN 2014 106.9 104.3 48 40 48.8


So how did these teams fare in close games? I've labelled a team/year as High if they won 6 or more games than expected (8 teams from the previous list), Low if they lost 6 or more  games than expected (13 teams from the previous list), and Normal otherwise. I then look for each group their win percentage in closely contested games (final scores within 1, 2 and 3 points).

Final scores within 1 point:

Type # Wins # Games Win %
Normal 721 1439 50.1
Low 8 21 38.1
High 2 2 100.0

Final scores within 2 points:

Type # Wins # Games Win %
Normal 1760 3515 50.1
Low 20 52 38.5
High 10 13 76.9

Final scores within 3 points:

Type # Wins # Games Win %
Normal 2820 5617 50.2
Low 24 80 30.0
High 14 19 73.7

Our intuition was correct and so were Daryl's closing comments: teams can indeed be qualified as lucky and unlucky, some winning almost 3 out of 4 close match-ups, others losing 2 out of 3 tight games. This intangible "luck" factor is sufficient to explain why certain teams have much better or worse records than their offense/defense would typically lead to. It doesn't take much for to flip the outcome of an entire game.


As a quick aside, much has been said about the San Antonio Spurs this year and their drop from a potential 2nd seed to 6th seed entering the Playoffs. Most articles focused on their loss on the final day of the regular season which led to that seeding free-fall, but was excessive focus placed on that last game? Had they been particularly lucky/unlucky during the season? It turns out their record is a couple games lower than what the modified Pythagorean theorem would have predicted, and that they weren't particularly lucky or unlucky in their close games, winning 2 of 5 games decided by 1 point, and 6 of 13 decided by 3 points or less.

Thursday, April 17, 2014

Infographic: Fight for the Eastern Conference #1 Seed

All season-long, Indiana set the #1 seed as their objective. While the Pacers completely dominated the first half of the season, they crumbled after the All-Star break (at the same time that Miami and Oklahoma) letting San Antonio capture the overall seed.

But while the overall top seed slipped through their fingers, keeping their grasp on the #1 Eastern conference seed against Miami was a nail-bitting battle till the last few games of the season.

The following infographics show which team had the best winning percentage throughout the regular season. The line is blue when Indiana has the best percentage, red when Miami had it.


Overall season evolution:


Since the All-Star break:


From a 'Ganes Behind' perspective:


Thursday, April 10, 2014

Best of the West or best of the rest?

The NBA finals are right around the corner. Only a handful of games are left to be played in this 2013-2014 season, and homecourt advantage is still a hard fought battle for the top teams.


Miami wants it to increase their odds of winning a third straight championship, Indiana wants it to turn the tables if (more like when) it meets Miami in the Eastern conference finals and avoid a game 7 in Miami like it did last year, San Antonio wants it for the exact same reason except it lost to Miami in game 7 of the finals, and OKC wants it in case it faces Miami in the finals (plus it could provide Kevin Durant with an additional edge on the MVP race against LeBron James).

So yes, everyone wants homecourt advantage, it's been proved over and over again (including in this blog) that there is a definitive advantage to playing 4 games instead of 3 at home in the best-of-7 format. But how key is it really? Does homecourt advantage really determine the NBA champions? Do other factors such as the conference you are in or the adversity faced in the first rounds play a part?

Following on the tradition of the past years, the West is clearly better than the East. Consider this: right now, the Phoenix Suns hold the eighth-best record in the West with 46 wins and 31 losses, and has the last seed for the playoffs. But only two teams have a better record than that in the East, Miami and Indiana. Stressing to hold the last playoff spot in one conference versus a comfortable third seed in the other? Talk about disparity!

But if you had to guess whether the next champ was going to be from the East or West what would you say? That the eastern team would have an easier road to the finals, less games, less fatigue than their western counterpart? Or does evolving in a hyper-competitive bracket strengthen you, in a what-doesn-t-beat-you-makes-you-stronger argument?


Does the overall strength conference have an impact? Does the team with the best regular season record (and hence homecourt advantage) necessarily win? Does the team with the easiest path to the finals have an advantage?

To investigate this I've looked at all championships since 1990 (24 Playoffs) and looked in each case at some key stats for the two teams battling for the Larry O'Brien trophy, among these:
  • number of regular season wins
  • regular season ranking
  • sum of regular season wins for opponents encountered in the Playoffs
  • sum of regular season ranking for opponents encountered in the Playoffs
  • number of games played to reach the Finals
  • sum of regular season wins for all other Playoffs teams in their respective conferences
  • sum of regular season ranking for for all other Playoffs teams in their respective conferences
  • ...

So for Miami in 2013, the data would look something like:
  • 66 regular season wins
  • NBA rank: 1
  • played 16 games before reaching the Finals
  • 132 playoff opponent regular season wins (Indiana: 49, Chicago: 45, Milwaukee: 38)
  • 38.5 playoff opponent regular NBA ranking (Indiana: 8.5, Chicago: 12, Milwaukee: 18)
  • 320 playoff conference regular season wins (Indiana: 49, New York: 54, Chicago: 45, Brooklyn: 49, Atlanta: 44, Milwaukee: 38, Boston: 41)
  • 84.5 playoff opponent regular NBA ranking (Indiana: 8.5, New York: 7, Chicago: 12, Brooklyn: 8.5, Atlanta: 14 Milwaukee: 18, Boston: 16.5)
  • ...
As for the Spurs who were the other 2013 finalists, they had a worse record, emerged from a tougher conference and met stronger opponents while needing surprisingly less games to reach the Finals:
  • 58 regular season wins
  • NBA rank: 3
  • played 14 games before reaching the Finals
  • 148 playoff opponent regular season wins (LA Lakers, Golden State, Memphis)
  • 27.5 playoff opponent regular NBA ranking (LA Lakers, Golden State, Memphis)
  • 366 playoff conference regular season wins (Memphis, Oklahoma, Golden State, Denver, Houston, LA Lakers, LA Clippers)
  • 51 playoff opponent regular NBA ranking (Memphis, Oklahoma, Golden State, Denver, Houston, LA Lakers, LA Clippers)
  • ...


I then ran various models (simple logistic regression, and lasso logistic regression) to see how these different metrics helped predict who would win the champion come the Finals.

The conclusions confirmed our intuition:
  • having more regular season wins that your opponent in the Finals provides a big boost to your chance of winning (namely by securing homecourt advantage, but the exact number of games provided a much better fit than a simple homecourt advantage yes/no variable)
  • there were indications that having a tougher path to reach the finals (more games, tougher opponents) slightly reduced the probability of winning the championship, but none of those effects were very significant

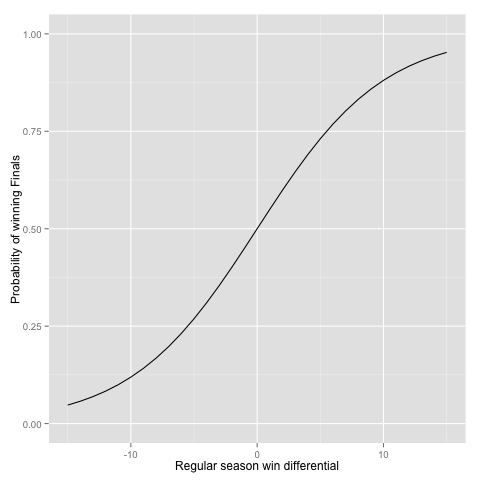
The effect from difference in regular season wins can be seen on the following graph, where we have compared two (almost) identical teams evolving in identical conferences. The only difference between the two teams is the number of wins they've had in the regular season, shown on the x-axis. The y-axis shows the probability of winning the championship.


A five-game differential in wins will translate with a 73% / 27% advantage to the team with the most wins. Only a one-game advantage translates into a 55% / 45% advantage.

The conference effect appears quite minimal, and home-court advantage appears to be key. If Indiana hates itself right now for having let the number 1 seed in the East slip through its fingers, it can always try to comfort itself with the fact that (unless a major San Antonio / Oklahoma / LA Clippers break down occurs over the remaining games of the season), the Western team making it to the Finals would have held homecourt advantage no matter what.

It should also be noted that a "bad" conference isn't synonym of easy opponents. Just look how Brooklyn seems to have the Heat's number this year, the way Golden State had Dallas' in 2007 when it beat the number 1 seed in the first round. All season long the Golden State Warriors were the only ones who could match up against Dallas really well.

UPDATE: as of yesterday, Indiana has reclaimed the top seed in the East, but the final argument can be applied to Miami just as well. Whichever of these teams makes it to the Finals will face a tough opponent.


Wednesday, April 10, 2013

Drama in Lakerland continues

Edit as of 4/10/2013 2:40pm
The drama continues, my model had the tiebreaker backwards, giving LA the advantage of the tie. Corrected values are at the bottom of the post.


The Lakers making the Playoffs or not has without a doubt been the most talked about conversation of the 2012-2013 season. And you would think that with just a handful of games to be played in the regular season we would finally have at definite answer or at least a pretty good idea.

But we would be forgetting this is LA/Hollywood we're talking about (I just know a movie is going to be made one day around this whole story).

So the Lakers currently have the 8th and final spot in the West (with a Laker win/Utah loss combination yesterday), half a game in front of Utah, but Utah has the tie-breaker in case the two teams end the season with same number of wins.

So what does the rest of the season look like? The experts have weighed in on NBA.com's blog but what do the stats say?

Running some new simulations based on the latest results, factoring the strength of the opponents and home game advantage for the last games, we have the following results:

Position Lakers Probability Mavericks Probability Jazz Probability
7 0.4 NA NA
8 73.7 6.5 19.4
9 20.3 17 62.7
10 5.6 76.5 17.9

Because I am more of a data-driven guy, I hereby declare the Lakers IN THE PLAYOFFS!!

4/10/2013 2:40pm
The drama continues, my model had the tiebreaker backwards, giving LA the advantage of the tie. When corrected, the Lakers playoffs drop to 50.1% !!
As a statistician I cannot pronounce myself with this value....

Here are the details:
Position Lakers Probability Mavericks Probability Jazz Probability
7 0.6 NA NA
8 50.1 7.1 42.2
9 39.3 18.1 42.6
10 10 74.8 15.2


Friday, March 8, 2013

Crazy end of season!! (a.k.a. "For the 100th time, will the Lakers make the Playoffs?")

When I posted my predictions for the end of the season, I felt like I had some time before having to update these. However, in light of recent results, namely the Lakers pretty hot streak and a back-from-25-down comeback in New Orleans, the hype is back as to whether or not the Lakers will make it into the finals. Some have even argued that given how tight the last Playoff spots are in the West, the Lakers can even hope to get in the 7th or even 6th spot. But their future is not entirely in their hands, a lot depends on how the Warriors, Jazz and Rockets perform.

Let's see how the odds of each of these teams making it into the Playoffs has evolved and upadte our forecasts based on most recent games:


Only in Hollywood-land could an NBA team's probability of making the Playoffs jump from 10% to 40% in a matter of three weeks with only a quarter of the season remaining. All experts (and stats bloggers like me :-)) agreed that the Lakers' Playoff run would require a big slip by one or more of the team's ahead, and that is exactly what the Jazz is handing the Lakers on a silver.... scratch that, golden platter, with a probability drop from 90% to 55% over the same three weeks! Talk of a big slip! But to make this the perfect Hollywood script, the Lakers should clinch that 8th spot with a win on the final regular season against Houston...

Here's a table summarizing most recent values as of 2013-03-08:

Team Playoff Probability
SAS 100%
OKC 100%
LAC 100%
MEM 100%
DEN 100%
GSW 98.9%
HOU 90%
UTA 55.2%
LAL 43%
POR 7.3%
DAL 5.6%
MIN 0%
PHO 0%
NOH 0%
SAC 0%

Given the current excitement and hype, I'm guessing I will be posting updates sooner rather than later!


Monday, February 18, 2013

Who will make the Playoffs?


The All-Star weekend is a nice break in the middle of the regular season. Dunk contest, three-point contest, rising stars game and naturally the All Star game itself. A good break indeed from the intense regular season schedule.

But for me it offered a unique opportunity: no games for four consecutive nights! The perfect opportunity to run simulations. Many simulations.

A. Downpour. Of. Simulations.

You be the judge: the outcome of over 2 BILLION games were simulated.

I previously worked on some code to forecast the outcome of the rest of the season based on each team's latest performance, code which I have already used to look at the Lakers probability of making the Playoffs, and whether Dallas or LA (Lakers) had a better chance of making the Playoffs. But I was eagerly waiting for the All Star weekend to run the code for all days starting on December 1st 2012, in order to look at the trends and shifts in each team's probability of making the Playoffs, and each team's expected final standing.

Here are the results by conference.

Eastern Conference

Let's start by looking at the evolution of team standings:

And now for the evolution of the probability of making it to the Playoffs:

The last values as of February 15th 2013 give the following values:

Team Position Playoff Probability
MIA 1.196 100%
NYK 3.157 100%
BRK 4.455 99.8%
IND 4.076 99.8%
CHI 4.445 99.7%
ATL 4.942 99.6%
BOS 6.706 95.4%
MIL 7.230 91.4%
PHI 9.666 8.2%
TOR 10.195 4.2%
DET 10.588 1.8%
WAS 13.069 0.1%
CHA 14.470 0%
CLE 12.564 0%
ORL 13.241 0%

Although Philadelphia still has a glimmer of hope of making the Playoffs provided Milwaukee runs into a very bad stretch, the eastern teams making the Playoffs seem decided. The huge uncertainty however lies around positions 3-6 where all teams are extremely close. With the Brooklyn Nets facing Chicago and Indiana in the last two weeks of the regular season, the eastern final brackets will not be decided until the very end.


Western Conference

Similarly to what we did for the Eastern Conference, let's start by looking at the standings evolution:

And now for the "Playoff Probability" evolution:

The last values as of February 15th 2013 give the following values:

Team Position Playoff Probability
LAC 2.749 100%
OKC 2.371 100%
SAS 1.329 100%
DEN 4.899 99.9%
MEM 4.682 99.5%
GSW 5.824 97.5%
UTA 7.190 86.9%
HOU 7.550 80.7%
POR 9.752 14.8%
LAL 9.877 12.1%
DAL 10.376 8.1%
MIN 12.519 0.4%
NOH 12.870 0.1%
PHO 14.224 0%
SAC 13.788 0%

The story is a little different on the western front, where suspense is not around the center 3-6 positions and the final Playoff bracket but on the final eight spot. Houston has a good chance of keeping that spot which it currently holds, but Portland and Los Angeles (Lakers of course!) are on their heels from a safe-but-not-THAT-safe distance. Any slip and the two will pounce on the position!


I will provide updated probabilities as the season progresses!


Tuesday, February 12, 2013

Nice infographics on the Lakers' last road trip

Given I'm in the midst of analyzing the Lakers' performance and chances of making the Playoffs, I thought I'd share this pretty neat infographics tweeted by the Los Angeles Lakers (@Lakers), summarizing their last 7-game road trip. Experts on NBA.com said they would reconsider the Lakers for Playoffs if they went 5-2 or better on this road trip, they fell just short with 4-3.

Based on my most recent analysis, their current probability of making the Playoffs is 15.7%.


Monday, February 11, 2013

NBA article: CAN LAKERS OR MAVS TAKE NO. 8 IN WEST?


I wrote a post a couple of weeks ago on the Lakers' odds of making it to the playoffs. While currently working on another post on what the final Playoff picture will most likely look like for both conferences and all positions, I wanted to respond to an article on NBA.com on whether the Lakers or the Mavericks have a shot at the #8 spot in the West.

Portland, Houston and Utah have not be doing as well lately as they had been until now, which might give both the Lakers and the Mavericks some hope for some post-season action.

Running some simulations for all five teams' upcoming performance, here's what transpired:


Position Lakers Probability Mavericks Probability Jazz Probability TrailBlazers Probability Rockets Probability
3 / / / / 0.4
4 / 0.2 0.8 0.1 0.9
5 0.1 0.2 3 0.3 3
6 1.1 0.3 10.4 1.9 10.2
7 3.9 4.2 26.9 9.3 32.1
8 10.6 8.7 28.8 14.6 29.9
9 20.7 15.3 18.8 27.2 14.2
10 29.7 25.1 8 24.1 6.8
11 26.1 32.9 2.5 16.9 2.2
12 6 8.8 0.8 4.6 0.3
13 1.4 3.1 / 0.7 /
14 0.4 0.9 / 0.3 /
15 / 0.3 / / /

The Lakers' probability of making the Playoffs is 15.7% and has significantly increased over the past two weeks since my previous post, thanks to three consecutive wins at home before winning 4 out of 7 during a grueling road trip! This 70% win probability over the last 10 games has boosted home and road winning percentages in the model.

As for the Mavericks, their probability of making the Playoffs is close to the Lakers: 13.6%. The Trailblazers' have almost twice as much of a chance of making with 26.2%. The Jazz (69.9%) and Rockets (76.5%), have less to concern themselves with at this point, but should still remain on their guards, there are no guarantees in the NBA!

So while the Rockets', Jazz's and Trailblazers' latest stumbles can give Lakers and Mavericks fans some hope, they should remain realists, the road to climb out of their respectives holes to reach the eight spot is long and difficult one, but there is no doubt that both teams will fight till the final game!


Tuesday, January 22, 2013

From "Will they be champs?" to "Will they make the playoffs?"


I have not posted any basketball-related articles since sharing my data-driven predictions for the 2012 NBA Finals (unfortunately for me, the data suggested the Oklahoma City Thunder had a slight advantage against the Miami Heat).

But there has been SO much talk recently on the Los Angeles Lakers' performance that I just had to take a stab at predicting their season outcome.


Background

For those of you not too familiar with the situation, it has all the drama of a Hollywood script, and I will briefly summarize the situation.

The Lakers have had great results in the past years, winning the championship in 2009 and 2010, and being tough opponents in the other years. Over the 2012 summer and a disappointing 2012 year, they signed a couple of superstars: Steve Nash from Phoenix, desperate to win a championship and one of the league's top point guards, as well as Dwight Howard from Orlando, who can be quite a beast under the basket. On paper they were an All-Star team, nobody contested that. Almost everyone had them reaching the Finals, the only question was whether they would beat Miami or not.

But their performance so far surprised even the most pessimistic: they started the season by accumulating losses, and have lost more games than they have won since the start of the season. Things get worse as they are in the Western Conference which is much more competitive than the Eastern conference. Add in a fired coach, a surprising replacement coach, and you have all the drama necessary for a lot of ink to be poured!

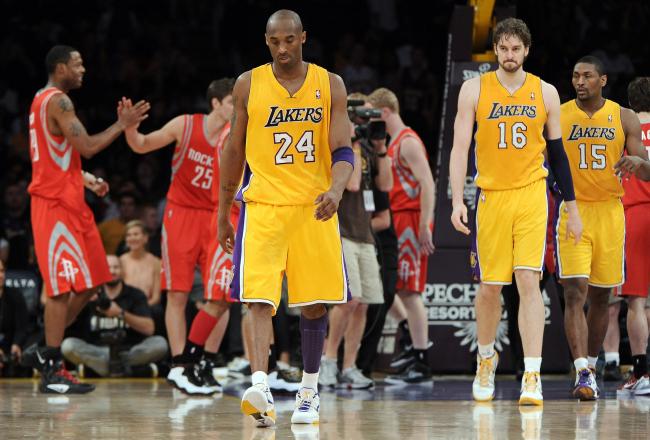
Total confusion on the court has been a common sight in the Staples Center:

And so the questio has become: will the Lakers even make it to the NBA playoffs? Only the best eight teams of the Western conference make the playoffs. Many analysts have looked at historical data, noticing that the eight team in the West has an average of 48 wins, and if the Lakers want to reach 48 wins this season they need to start winning fast.

I've decided to take a slightly different approach, by tring to forecast what the rest of the season would look like for all teams based on the first half of the season. Also, the previous methodology ignores what the rest of the teams are doing in your conference, as well as the impact of playing another team also fighting for a playoff spot. When you win against one of those teams, it basically counts double!


Methodology

Here's the methodology I've taken:
  • extract all of the 2012-2013 season scores and schedule data for all teams, namely home and away winning percentages
  • for all upcoming games I compute the home team's probability of victory as follows:
    home team winning percentage / (home team winning percentage + away team winning percentage).
    For example: Let us say that Chicago with a 12-5 road record (70.8% road winning percentage) is visiting Miami with a 16-3 home record (84.2% home winning percentage), I would estimate Miami's probability of winning the game as:
    84.2% / (84.2% + 70.8%) = 54.4%.
  • Based on this probability, I simulate the game's outcome and then update Chicago's and Miami's records (if Chicago wins, their road record is now 13-5 and Miami's home record becomes 16-4).
  • I continue proceeding that way until all the season's games have been simulated. This then becomes one possible outcome for the season.
  • I then repeat the entire process outlined above thousands of time to get an idea of all the scenarios that can play out.
Based on the simulations, I can then determine which teams are most likely to have the best record in the NBA, and, going back to our original question, how likely the Lakers are to make the playoffs.


Results

Here are the results (based on scores up to 21/01/2013):

Top three NBA records:
  • First place:
    Oklahoma City Thunder (32.9%), San Antonio Spurs (29.2%), Los Angeles Clippers (28%)
  • Second place:
    San Antonio Spurs (26.6%), Oklahoma City Thunder (24%), Los Angeles Clippers (23.4%)
  • Third place:
    San Antonio Spurs (18.7%), Oklahoma City Thunder (17.6%), Los Angeles Clippers (17.1%)
Clearly, the odds are that these three teams will enter the playoffs with the best records and so most likely a Western Conference team will have homecourt advantage in the Finals!

As for the Lakers, here are the probabilities of their final standing in the Western conference:

Position Probability
6 0.4
7 1.4
8 4.1
9 8.9
10 12.6
11 18.1
12 24.2
13 16.9
14 10
15 3.4

Wow! Only a 5.9% probability of the Lakers making the Playoffs!

But let's still monitor them closely, and I'll update these results in the weeks to come.

Please leave a comment if you have any questions/suggestions on the methodology and/or results!